12 Mean Inference
In this section, we describe how you can use Rguroo to construct confidence intervals and conduct tests of hypotheses for a single population mean and the difference of two population mean. You can perform these analyses using both summary statistics and raw data. Rguroo has many methods, including theory-based and simulation-based methods. In this guide, we will show examples of basic methods. By default, tests of hypotheses are performed using p-values. However, you can see output based on the critical region method by clicking on the ![]() buttons.
buttons.
12.1 Confidence Interval for a Single Population Mean
Instructions for obtaining confidence interval for single population mean with summary data
Open the Analytics toolbox on the left-hand side of the Rguroo window. Use the
Analysisdropdown menu and choose Mean Inference —> One Population . The One Population Mean Inference dialog will open (see Figure 12.1).In the Data section, Enter Sample Mean, one or both of Sample Standard Deviation or Population Standard Deviation, and the Sample Size.
In the textbox labeled \(\bf\mu\) = Mean of, enter a variable label.
In the
Confidence Intervaltab, set the confidence level, and select one or both of t-statistic orrdes(“z-statistic”)`.Click the Preview icon
 to view the result.
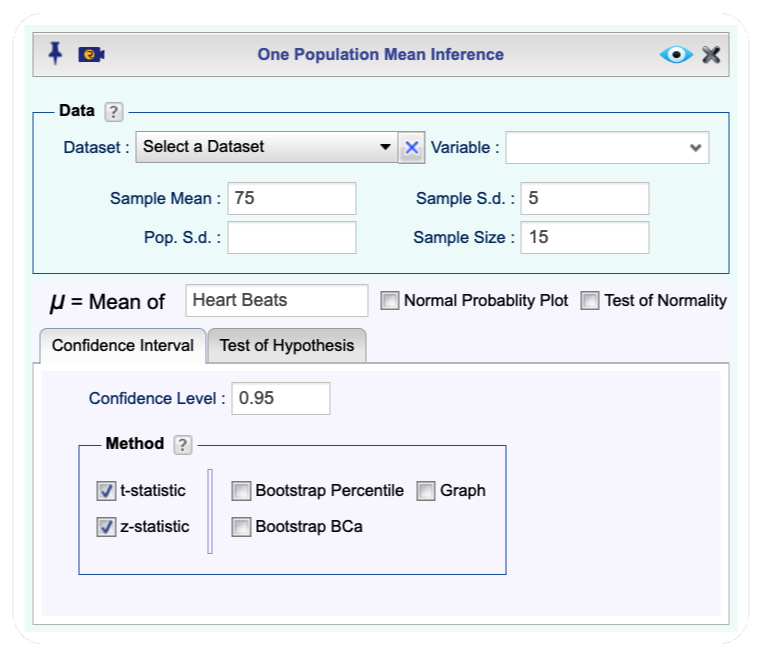
Figure 12.1: One population mean inference dialog.
Instructions for obtaining confidence interval for single population mean with raw data
- Use a dataset in your Rguroo account or recreate the example below by importing the cardata dataset from the Rguroo dataset repository called Rguroo Users Guide into your account.
Click here to see a portion of the dataset.

Open the Analytics toolbox on the left-hand side of the Rguroo window. Use the
Analysisdropdown menu and choose Mean Inference —> One Population (see Figure 12.2).Select a Dataset and a Variable. The summary statistics will automatically populate.
In the
Confidence Intervaltab, set the confidence level, and select one or more of the methods.Click the Preview icon
 to view the result.
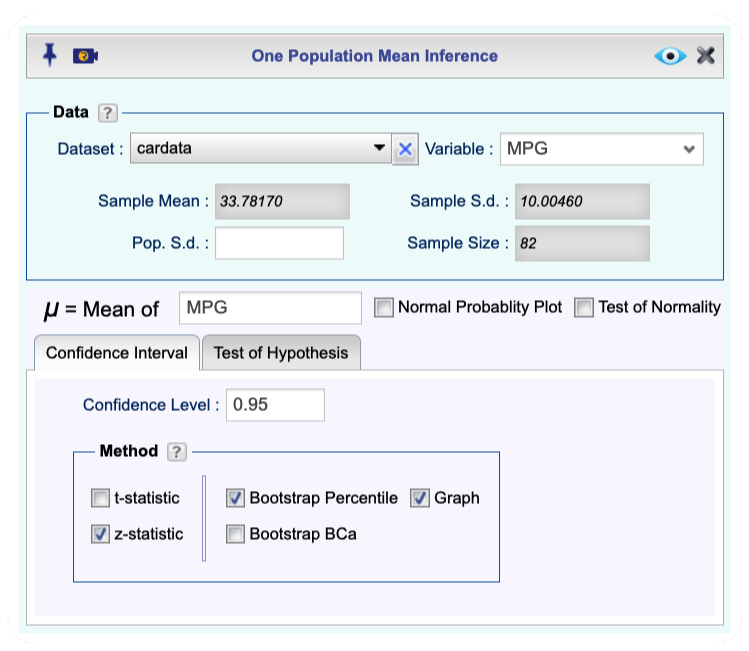
Figure 12.2: One population mean inference dialog.
12.2 Confidence Interval for Difference of Two Population Means (Independent Samples)
Open the Analytics toolbox on the left-hand side of the Rguroo window. Use the
Analysisdropdown menu and choose Mean Inference —> One & Two Population. The Two Population Mean Inference dialog will open (see Figure 12.3).Under the
Summarytab enter the following information for Populations 1 and 2: Label, Sample Mean, Sample Size, and one or both of Sample S.d. and Pop S.d..Click the
Population 1-2tab, and in theConfidence Intervaltab enter the Confidence level, and select one or both of the methods t-statistic or z-statistic, as appropriate.Click the Preview icon
 to view the result.
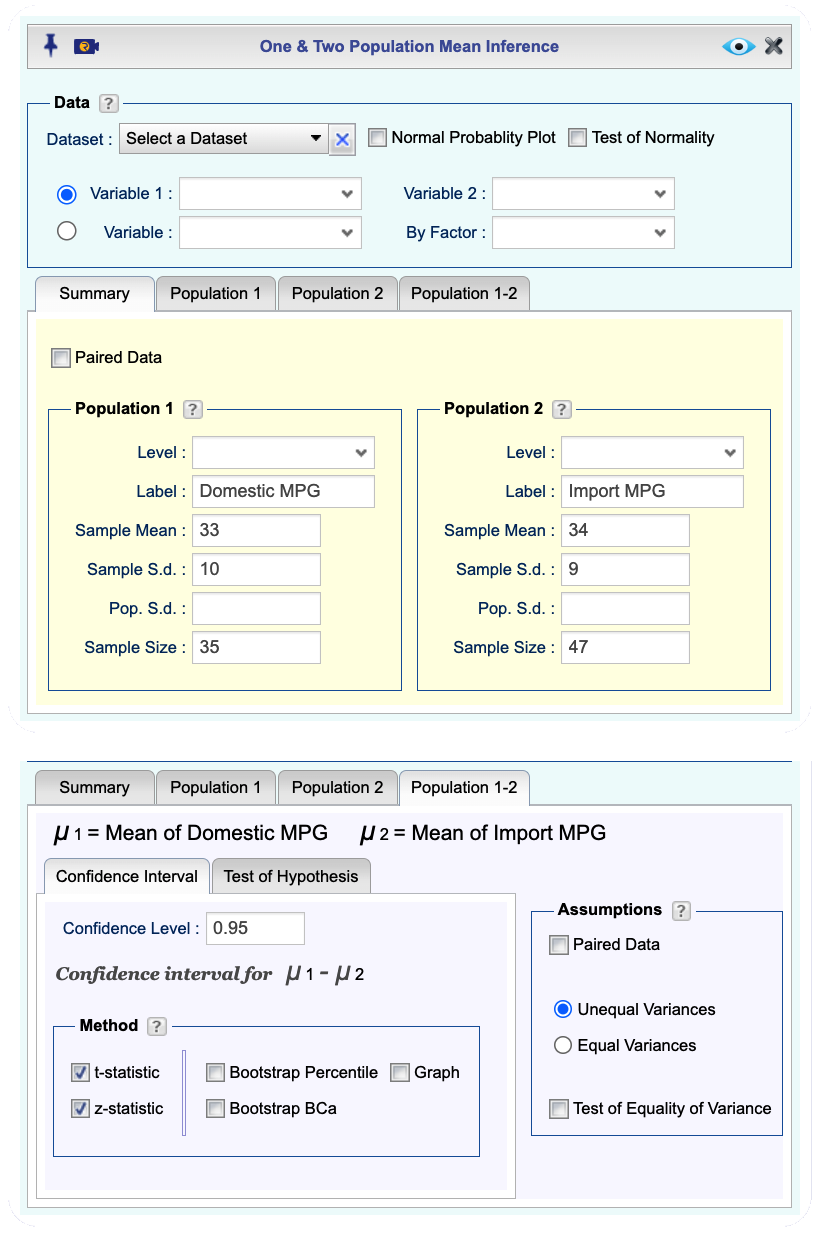
Figure 12.3: Two population mean inference dialog.
Instructions for obtaining confidence interval for difference of two population means with raw data
- Use a dataset in your Rguroo account or recreate the example below by importing the cardata dataset from the Rguroo dataset repository called Rguroo Users Guide into your account.
Click here to see a portion of the dataset.

Open the Analytics toolbox on the left-hand side of the Rguroo window. Use the
Analysisdropdown menu and choose Mean Inference —> One & Two Population. The Two Population Mean Inference dialog will open (see Figure 12.4).Select a Dataset.
There are two methods for data input in the Data section:
If the data for the two populations are in two numerical columns, select the columns from the Variable 1 and Variable 2 dropdowns. The summary statistics for Populations 1 and 2 automatically populate under the
Summarytab.If one variable includes numerical values and there is a corresponding factor (categorical) variable that includes indicators for Population 1 and 2, select the numerical variable from the Variable dropdown and the factor (categorical) variable from the By Factor dropdown. In this example, we use this method where we compare Miles Per Gallon (MPG) for Domestic and Imported cars.
(This step is required if you used Method 4b). In the
Summarytab from the Level dropdowns, select the indicators for Population 1 and Population 2. The summary statistics for Populations 1 and 2 automatically populate under theSummarytab.Click the
Population 1-2tab, and in theConfidence Intervaltab enter the Confidence level and select one or more of the methods as appropriate.(Optional) In the Assumptions section select appropriate assumptions.
Click the Preview icon
 to view the result.
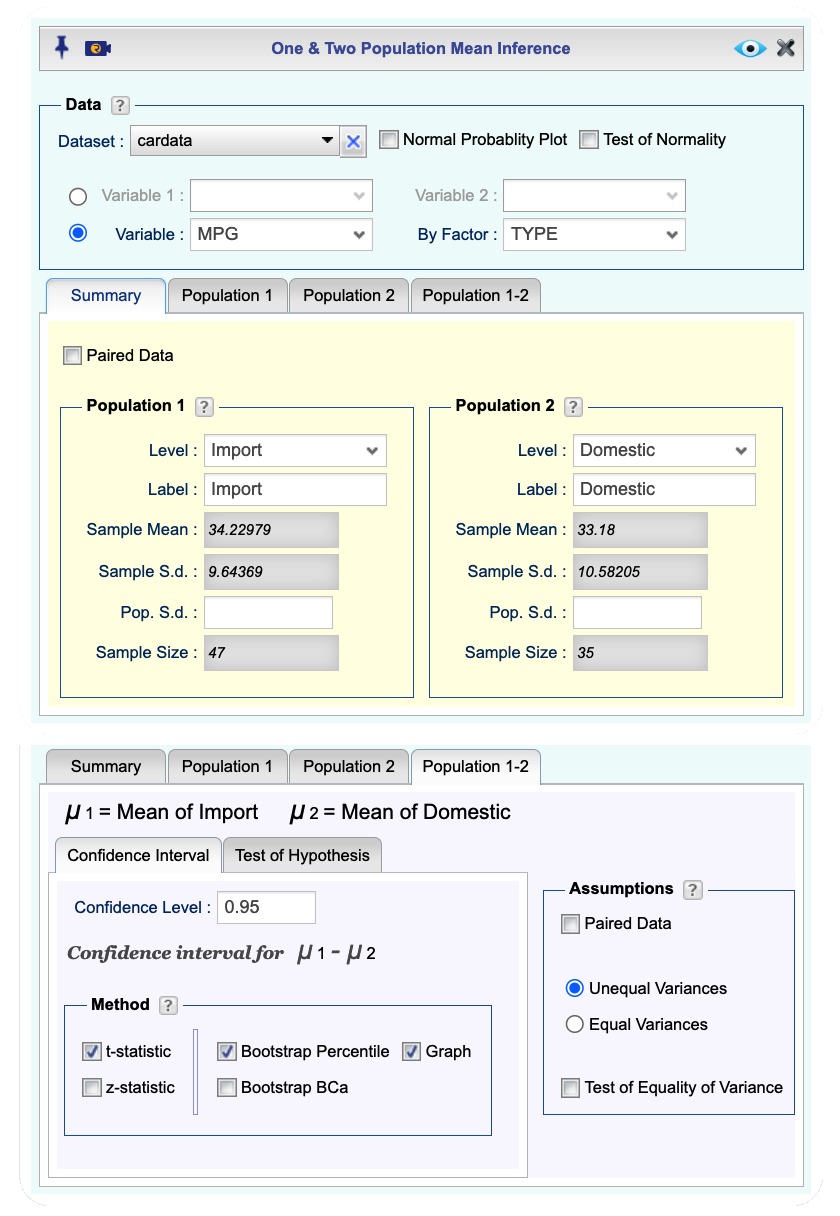
Figure 12.4: Two population mean inference dialog.
12.3 Confidence Interval for Difference of Two Population Means (Paired Data)
Instructions for obtaining confidence interval for difference of two population means with paired data
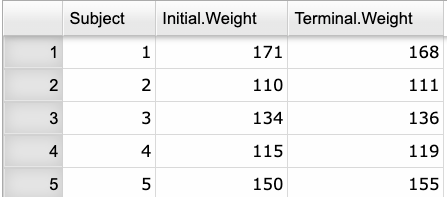
- Use a dataset in your Rguroo account or recreate the example below by importing the freshman_weight dataset from the Rguroo dataset repository called Rguroo Users Guide into your account.
Click here to see a portion of the dataset.
Open the Analytics toolbox on the left-hand side of the Rguroo window. Use the
Analysisdropdown menu and choose Mean Inference —> One & Two Population. The Two Population Mean Inference dialog will open (see Figure 12.5).Select a Dataset.
There are two methods for data input in the Data section:
If the data for the two populations are in two numerical columns, select the columns from the Variable 1 and Variable 2 dropdowns. The summary statistics for Populations 1 and 2 automatically populate under the
Summarytab.If one variable includes numerical values and there is a corresponding factor (categorical) variable that includes indicators for Population 1 and 2, select the numerical variable from the Variable dropdown and the factor (categorical) variable from the By Factor dropdown. In this example, we use this method where we compare Miles Per Gallon (MPG) for Domestic and Imported cars.
(This step is required if you used Method 4b). In the
Summarytab from the Level dropdowns, select the indicators for Population 1 and Population 2. The summary statistics for Populations 1 and 2 automatically populate under theSummarytab.After you are done with steps 4 and 5, select the checkbox Paired Data. The summary statistics for the Paired Differences auto-fill.
Click the
Population 1-2tab, and in theConfidence Intervaltab enter the Confidence level and select one or more of the methods as appropriate.Click the Preview icon
 to view the result.
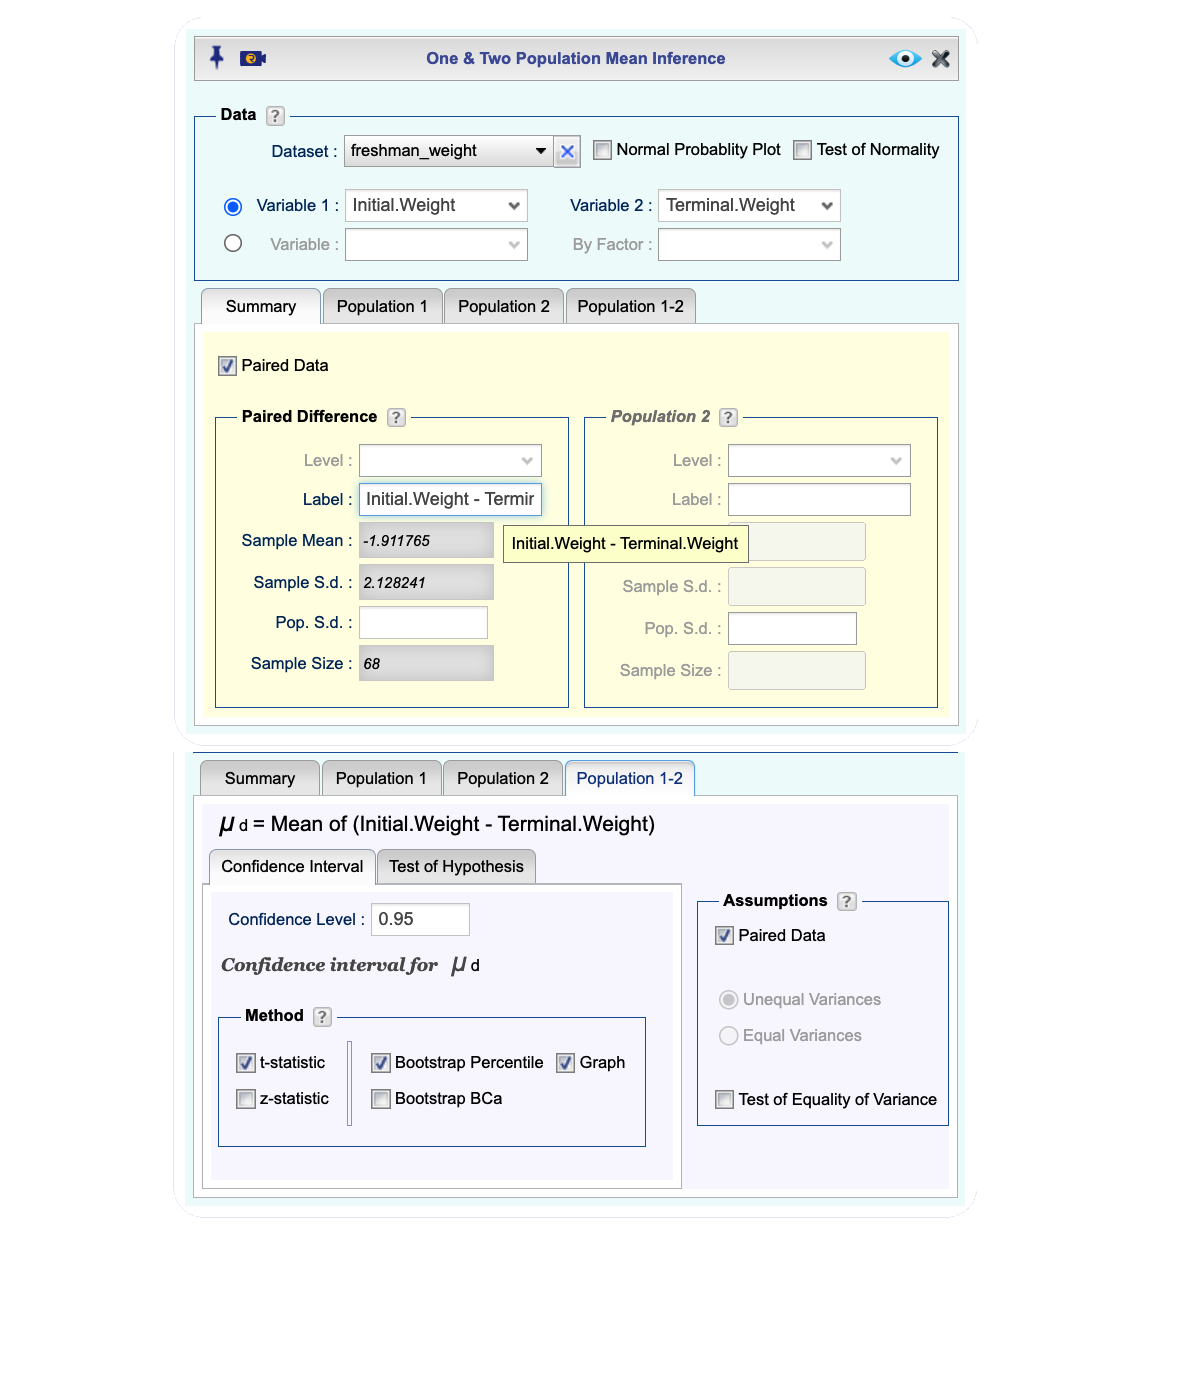
Figure 12.5: Two population mean inference dialog.
12.4 Test of Hypothesis for a Single population mean
Instructions for testing hypothesis for a single population mean with summary data
Open the Analytics toolbox on the left-hand side of the Rguroo window. Use the
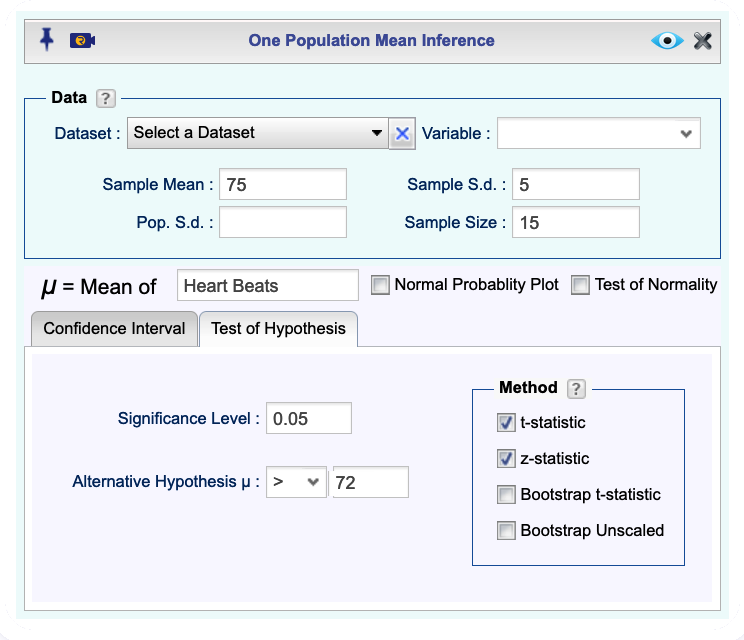
Analysisdropdown menu and choose Mean Inference —> One Population . The One Population Mean Inference dialog will open (see Figure @ref(fig:onePop_Summary_ht)).In the Data section, Enter Sample Mean, one or both of Sample Standard Deviation or Population Standard Deviation, and the Sample Size.
In the textbox labeled \(\bf\mu\) = Mean of, enter a variable label.
In the
Test of hypothesistab, set the confidence level, and select one or both of t-statistic orrdes(“z-statistic”)`.Click the Preview icon
 to view the result.
Instructions for testing hypothesis for a single population mean with raw data
- Use a dataset in your Rguroo account or recreate the example below by importing the cardata dataset from the Rguroo dataset repository called Rguroo Users Guide into your account.
Click here to see a portion of the dataset.

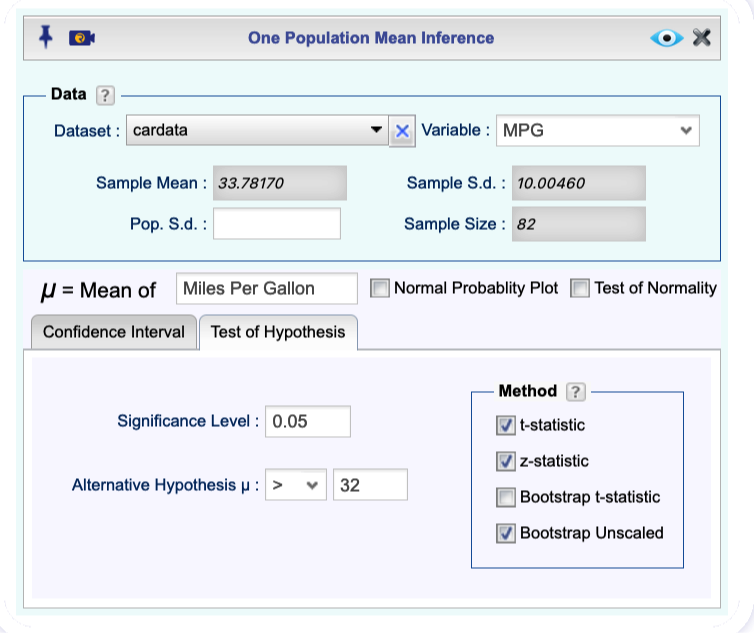
Select a Dataset and a Variable. The summary statistics will automatically populate.
In the
Test of Hypothesistab, set the confidence level, and select one or more of the methods t-statistic, z-statistic, Bootstrap t-statistic, and Bootstrap Unscaled.Click the Preview icon
 to view the result.
12.5 Test of Hypothesis for Difference of Two Population Means (Independent Samples)
Instructions for testing hypothesis for difference of two population means with summary data
Open the Analytics toolbox on the left-hand side of the Rguroo window. Use the
Analysisdropdown menu and choose Mean Inference —> One & Two Population. The Two Population Mean Inference dialog will open (see Figure 12.6).Under the
Summarytab, enter the following information for Populations 1 and 2: Label, Sample Mean, Sample Size, and one or both of Sample S.d. and Pop S.d..Click the
Population 1-2tab, and in theTest of Hypothesistab, enter the Significance level, and Alternative Hypothesis for the difference \(\mu_1-\mu_2\).Select one or both of the methods t-statistic or z-statistic.
(Optional) In the Assumptions section, select Unequal Variances or Equal Variances.
Click the Preview icon
 to view the result.
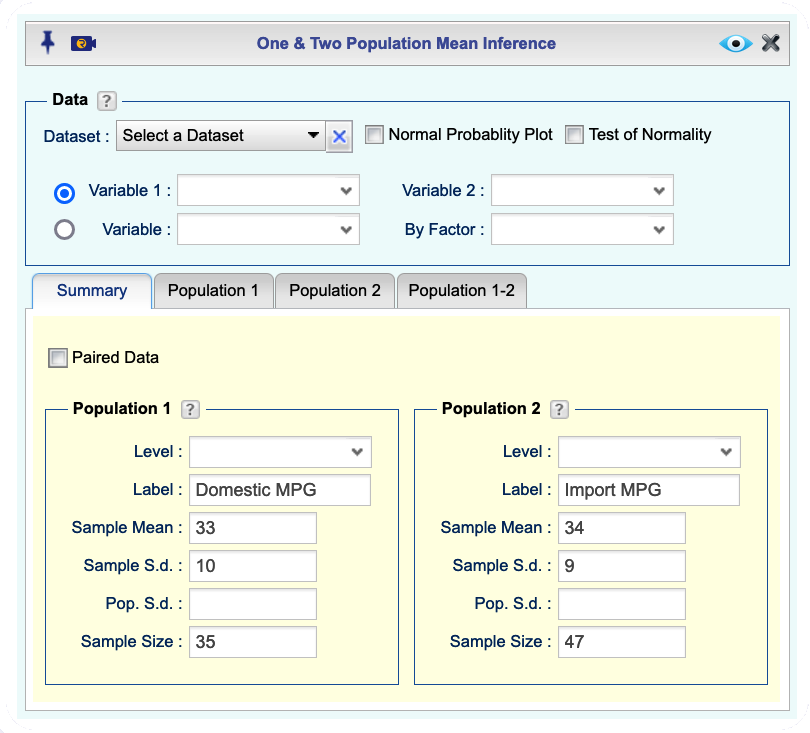
Figure 12.6: Two population mean inference dialog.
Instructions for testing hypothesis for difference of two population means with raw data
- Use a dataset in your Rguroo account or recreate the example below by importing the cardata dataset from the Rguroo dataset repository called Rguroo Users Guide into your account.
Click here to see a portion of the dataset.

Open the Analytics toolbox on the left-hand side of the Rguroo window. Use the
Analysisdropdown menu and choose Mean Inference —> One & Two Population. The Two Population Mean Inference dialog will open (see Figure 12.7).Select a Dataset.
There are two methods for data input in the Data section:
If the data for the two populations are in two numerical columns, select the columns from the Variable 1 and Variable 2 dropdowns. The summary statistics for Populations 1 and 2 automatically populate under the
Summarytab.If one variable includes numerical values and there is a corresponding factor (categorical) variable that includes indicators for Population 1 and 2, select the numerical variable from the Variable dropdown and the factor (categorical) variable from the By Factor dropdown. In this example, we use this method where we compare Miles Per Gallon (MPG) for Domestic and Imported cars.
(This step is required if you used Method 4b). In the
Summarytab from the Level dropdowns, select the indicators for Population 1 and Population 2. The summary statistics for Populations 1 and 2 automatically populate under theSummarytab.Click the
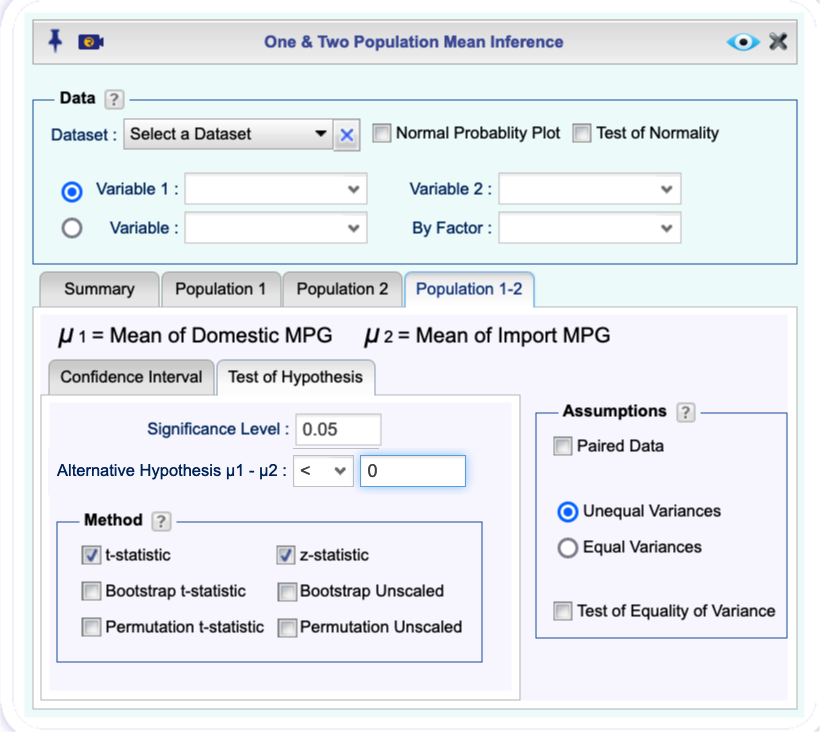
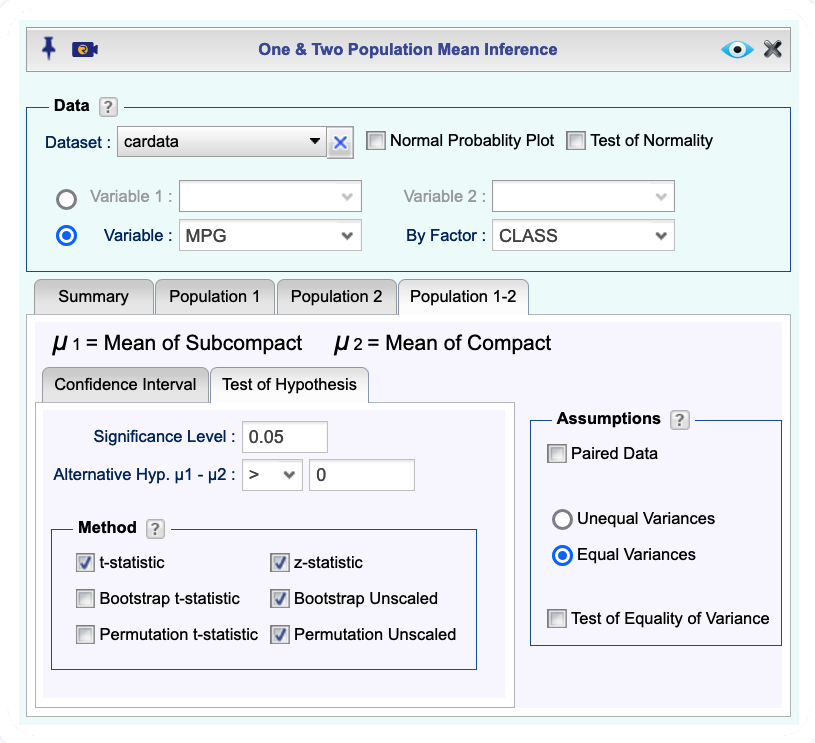
Population 1-2tab, and in theTest of Hypothesistab, enter the Significance level, and Alternative Hypothesis for the difference \(\mu_1-\mu_2\).Select one or more of the methods t-statistic or z-statistic, Bootstrap t-statistic , Bootstrap Unscaled, Permutation t-statistic , Permutation Unscaled.
(Optional) In the Assumptions section, select Unequal Variances or Equal Variances.
Click the Preview icon
 to view the result.
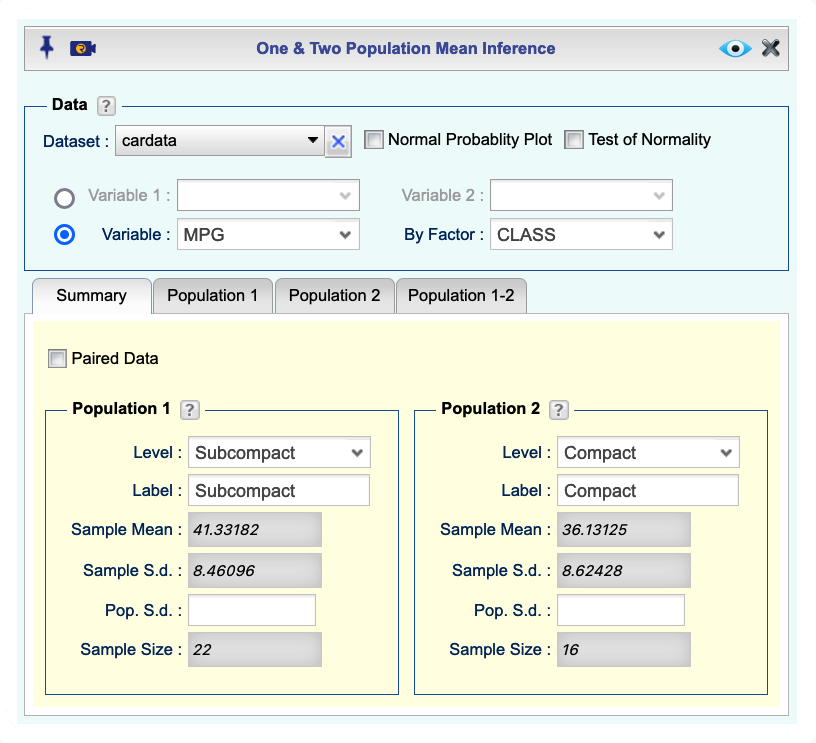
Figure 12.7: Two population mean inference dialog.
12.6 Test of Hypothesis for Difference of Two Population Means (Paired Data)
Instructions for testing hypothesis for difference of two population means with paired data
- Use a dataset in your Rguroo account or recreate the example below by importing the freshman_weight dataset from the Rguroo dataset repository called Rguroo Users Guide into your account.
Click here to see a portion of the dataset.

Open the Analytics toolbox on the left-hand side of the Rguroo window. Use the
Analysisdropdown menu and choose Mean Inference —> One & Two Population. The Two Population Mean Inference dialog will open (see Figure 12.8).Select a Dataset.
There are two methods for data input in the Data section:
If the data for the two populations are in two numerical columns, select the columns from the Variable 1 and Variable 2 dropdowns. The summary statistics for Populations 1 and 2 automatically populate under the
Summarytab.If one variable includes numerical values and there is a corresponding factor (categorical) variable that includes indicators for Population 1 and 2, select the numerical variable from the Variable dropdown and the factor (categorical) variable from the By Factor dropdown. In this example, we use this method where we compare Miles Per Gallon (MPG) for Domestic and Imported cars.
(This step is required if you used Method 4b). In the
Summarytab from the Level dropdowns, select the indicators for Population 1 and Population 2. The summary statistics for Populations 1 and 2 automatically populate under theSummarytab.After you are done with steps 4 and 5, select the checkbox Paired Data. The summary statistics for the Paired Differences auto-fills.
Click the
Population 1-2tab click theHypothesis Testtab and select Paired Data in the Assumptions section on the left.Enter the Significance level, and state the Alternative Hypothesis for \(\mu_d\), the mean of differences.
Select one or more of the methods t-statistic or z-statistic, Bootstrap t-statistic , Bootstrap Unscaled, Permutation t-statistic , Permutation Unscaled.
Click the Preview icon
 to view the result.
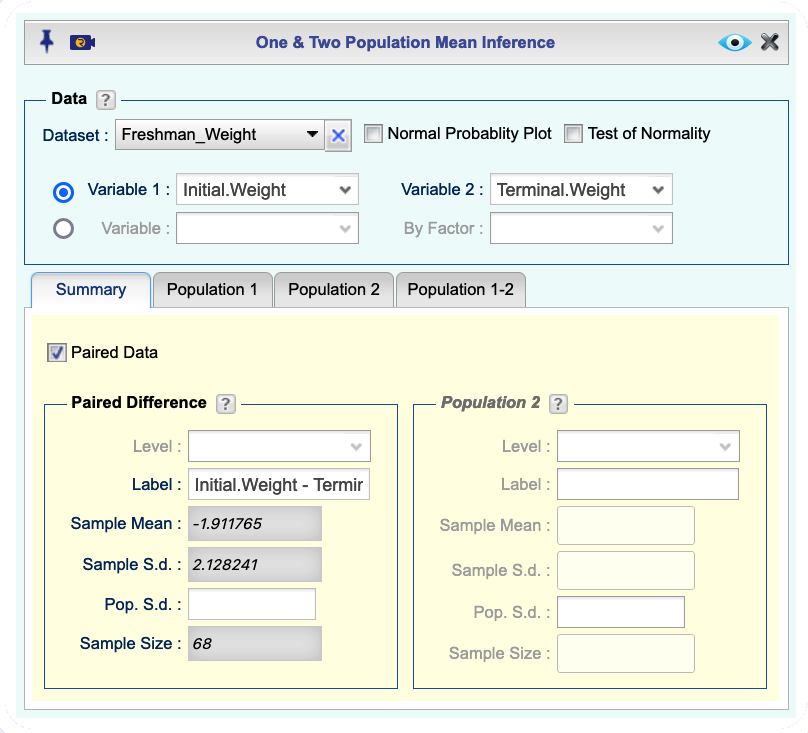
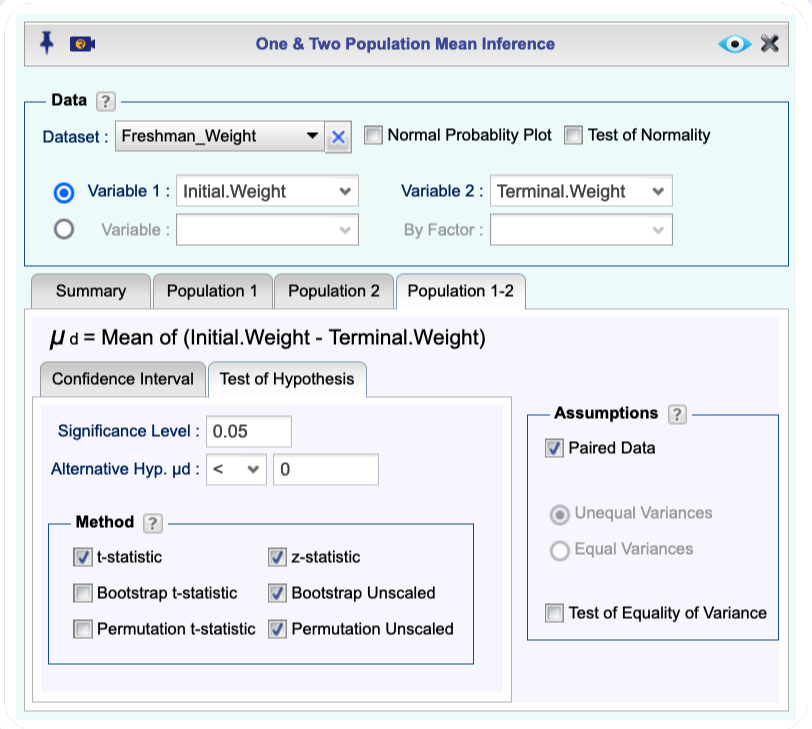
Figure 12.8: Two population mean inference dialog.
