17 Ridge Regression
Ridge regression is a technique used to address multicollinearity in linear regression models by introducing a penalty term that shrinks regression coefficients toward zero. This regularization approach improves model stability and predictive performance, particularly when independent variables are highly correlated or when the number of predictors exceeds the number of observations. In Rguroo, ridge regression is implemented with a user-friendly interface that allows you to specify either a single value or multiple candidate values for the regularization parameter (lambda). Alternatively, you can instruct Rguroo to automatically select an optimal lambda using generalized cross-validation (GCV) or k-fold cross-validation. Once the ridge regression model is fitted, you can easily make predictions for new or existing observations directly within Rguroo.
17.1 Fitting Ridge Regression Models
To perform ridge regression in Rguroo, begin by selecting Linear Regression from the Prediction–Classification toolbox. Then, under the model options, choose Ridge Regression. First, you need to specify the dataset, the response variable, and the model formula in the Basics dialog of the ridge regression interface. For detailed instructions on how to specify these inputs, see Section 15.1.
Figure 17.1 shows the Ridge Regression dialog, which is accessible through the Details dialog of the Ridge Regression function.
By default, Rguroo generates a sequence (grid) of candidate lambda values used for ridge regression modeling. This grid is automatically determined based on the data and the specified regression model, providing a practical starting point for selecting the optimal regularization parameter. As described in the next section, users also have the option to specify a custom range of lambda values.
The default output includes a plot of the coefficient paths, also known as a ridge trace plot. This plot shows how the regression coefficients change as the regularization parameter (lambda) varies. For better visualization, the horizontal axis is displayed on a logarithmic scale. If you select the Table checkbox, a corresponding table will be displayed showing the coefficients for each lambda value.
In addition, the output includes a plot of Root Mean Squared Error (RMSE) values for each candidate lambda, computed using k-fold cross-validation. The plot highlights the optimal lambda value based on the lowest RMSE. Finally, the output includes a table summarizing the ridge regression coefficients corresponding to this optimal lambda value, both in the original data scale and standardized scale.
You can optionally select the VIF Trace checkbox to include a plot of the Variance Inflation Factor (VIF) for each predictor variable across the range of lambda values. This plot helps assess multicollinearity in the model, as VIF values indicate how much the variance of each coefficient is inflated due to correlation with other predictors. Additionally, a table of VIF values corresponding to the lambda values is included in the output when the corresponding Table checkbox is selected.
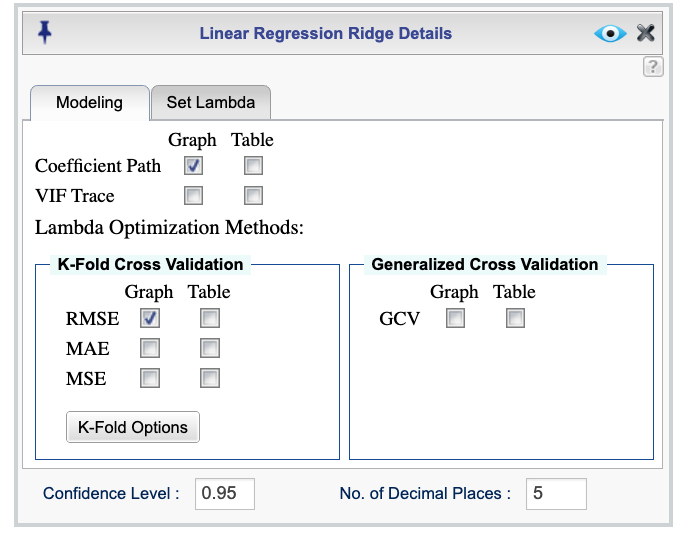
Figure 17.1: Ridge regression dialog
17.1.1 Methods for selecting an optimal Lambda
Rguroo provides two methods for selecting an optimal lambda value in ridge regression: k-fold cross-validation and generalized cross-validation (GCV). The Ridge Regression dialog includes options for both methods.
To select the optimal lambda using k-fold cross-validation, check one or more of the available selection metrics: Root Mean Squared Error (RMSE), Mean Absolute Error (MAE), or Mean Squared Error (MSE). For each selected metric, Rguroo provides a plot showing the metric values across the candidate lambda values, along with a table listing the corresponding lambda values. The optimal lambda, based on the minimum value of the selected metric, is also indicated. You can select the number of folds and set a random seed using the K-Fold Options button. By default, Rguroo uses 10 folds and randomly assigns cases to each fold. The default seed value is 100.
To use generalized cross-validation, select the Graph, Table, or both checkboxes under the Generalized Cross Validation (GCV) section. Rguroo will then compute GCV values for each candidate lambda and display the results in a plot and/or table. The optimal lambda is selected based on the lowest GCV value. GCV is particularly useful when you want a faster alternative to k-fold cross-validation, as it provides a reliable estimate of the optimal lambda without repeated model fitting.
17.1.2 Specifying candidate lambda values
Figure 17.2 shows the Set Lambda tab of the Ridge Regression dialog, which allows you to specify either a single value or a custom range of candidate lambda values for ridge regression. As noted earlier, Rguroo automatically generates a sequence of candidate lambda values based on the data and model specified in the Basics dialog. However, you can override this default behavior by entering your own values in this tab.
To specify a single lambda value, enter it in the Lambda textbox. When a single lambda is provided, Rguroo will use this fixed value for ridge regression without generating a sequence. The output in this case will include parameter estimates both in the original data scale and in the standardized scale.
There are two ways to specify a custom range of candidate lambda values:
Using the Lambda textbox: You can enter an R expression that generates a sequence of lambda values. For example, entering
seq(0.01, 10, by = 0.1)generates a sequence from 0.01 to 10 with increments of 0.1. Rguroo evaluates the expression and uses the resulting values as the candidate lambdas.Using the Create Lambda Grid checkbox: When this checkbox is selected, you can define the grid by specifying the Number of Lambda Values (default is 50), as well as the Min. Lambda and Max. Lambda values, which define the range. Rguroo then generates a sequence of evenly spaced lambda values within the specified range. You may also select the Log Scale checkbox to create the sequence on a logarithmic scale.
Once you have specified a range of lambda values, you can apply one of the lambda selection methods described in Section 17.1.1. The resulting output will include the plots and tables described in that section.
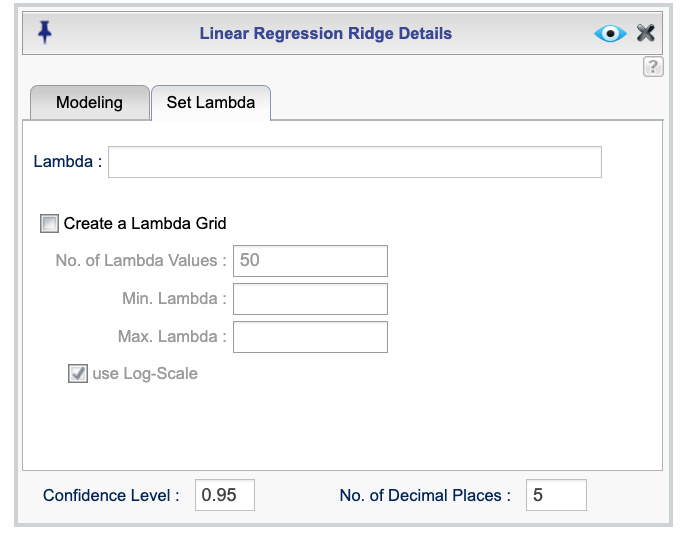
Figure 17.2: Ridge regression dialog for specifying lambda
17.1.3 Scaling, standardization, and centering
Rguroo automatically handles standardization and scaling of variables in ridge regression to ensure accurate estimation and prediction. When the model includes an intercept, numerical predictors and factor variables are standardized, and the response variable is centered. If the model does not include an intercept, standardization is turned off by default, but numerical predictors are scaled when present. These adjustments ensure that the effects of regularization are properly accounted for in both coefficient estimation and prediction.
17.2 Ridge Regression Prediction and residuals
Based on parameter estimates for a given value of the shrinkage parameter lambda, you can obtain predictions (fitted values) and residuals for internal data and predictions for external data. To do so, select Ridge Regression Prediction from the Linear Regression function menu in the Prediction–Classification toolbox. First, specify the dataset, response variable, and model formula in the Basics dialog. For detailed instructions on specifying these inputs, see Section 15.1. Note that the Basics dialog for the ridge prediction function includes an additional textbox labeled Lambda where you must specify the lambda value for fitting the model.
To set options for the ridge estimation and output, click the ![]() button. This opens the Linear Regression Ridge Prediction Details dialog, shown in Figure 17.3. In this dialog, you can choose whether to compute fitted values for internal data or predictions for external data. The available options are described below.
button. This opens the Linear Regression Ridge Prediction Details dialog, shown in Figure 17.3. In this dialog, you can choose whether to compute fitted values for internal data or predictions for external data. The available options are described below.
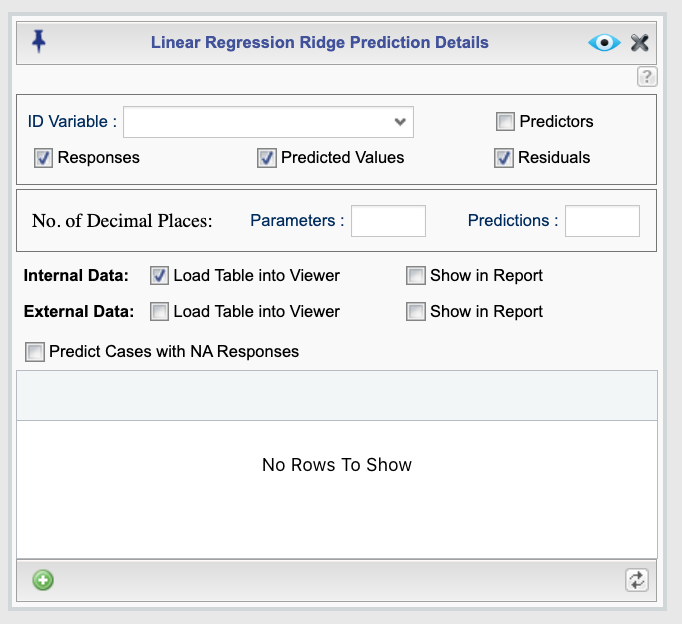
Figure 17.3: Ridge regression prediction dialog
Output Options
The output will include the ridge parameter estimates based on the specified lambda value. You can also choose to include the following columns in the prediction table for each case:
- ID Variable: The variable used to identify each observation. The selected variable will appear in the first column of the output table.
- Predictors: The predictor variables included in the model specified in the Basics dialog.
- Response: The values of the response variable for the cases used to fit the model (internal data).
- Predicted Values: The fitted values for internal data and the predicted values for external data (if any).
- Residuals: The residuals for the cases used to fit the model (internal data).
Additional options include:
- No. of Decimal Places: Set the number of decimal places for parameter estimates by entering a value in the Parameters textbox, and for predictions and residuals by entering a value in the Predictions textbox. If left blank, a default value is used.
Internal Data and External Data
- If you check the Load Table into Viewer checkbox next to Internal Data, the fitted values (i.e., predictions) for the cases used to fit the model will be computed and loaded into the viewer.
- If you check the Load Table into Viewer checkbox next to External Data, predictions will be generated for data not used in model fitting.
In both cases, the predicted values will appear in the viewer. The viewer can be used to filter, sort, and save the data as an Rguroo dataset, or to export it as a CSV or Excel file by right-clicking on the dataset.
If you check the Include Table in Report checkboxes next to Internal Data or External Data, the corresponding prediction tables will be included in the Rguroo report.
Specifying External Data
There are two ways to provide external data in Rguroo:
Using the main dataset:
Add external cases directly to the dataset used to fit the model, and set their response variable values toNA. Then check the Predict Cases with NA response box to generate predictions for these cases. Rguroo will treat all cases with NA responses as new observations and compute predictions for them.Using the built-in dataset editor:
After specifying a model, the dataset editor at the bottom of the dialog will display the names of the variables used in your model. You can manually enter values for new cases here:- For numerical variables, type the desired values.
- For categorical variables (factors), click a cell to display a dropdown list of available levels.
By default, the editor shows 5 rows, but you can add more by clicking the plus icon
 at the bottom of the editor. If you update the model and the variables are not appearing, click the refresh icon
  to reload the variable list.
- For numerical variables, type the desired values.
17.3 Example: Ridge Regression on the Diabetes Dataset
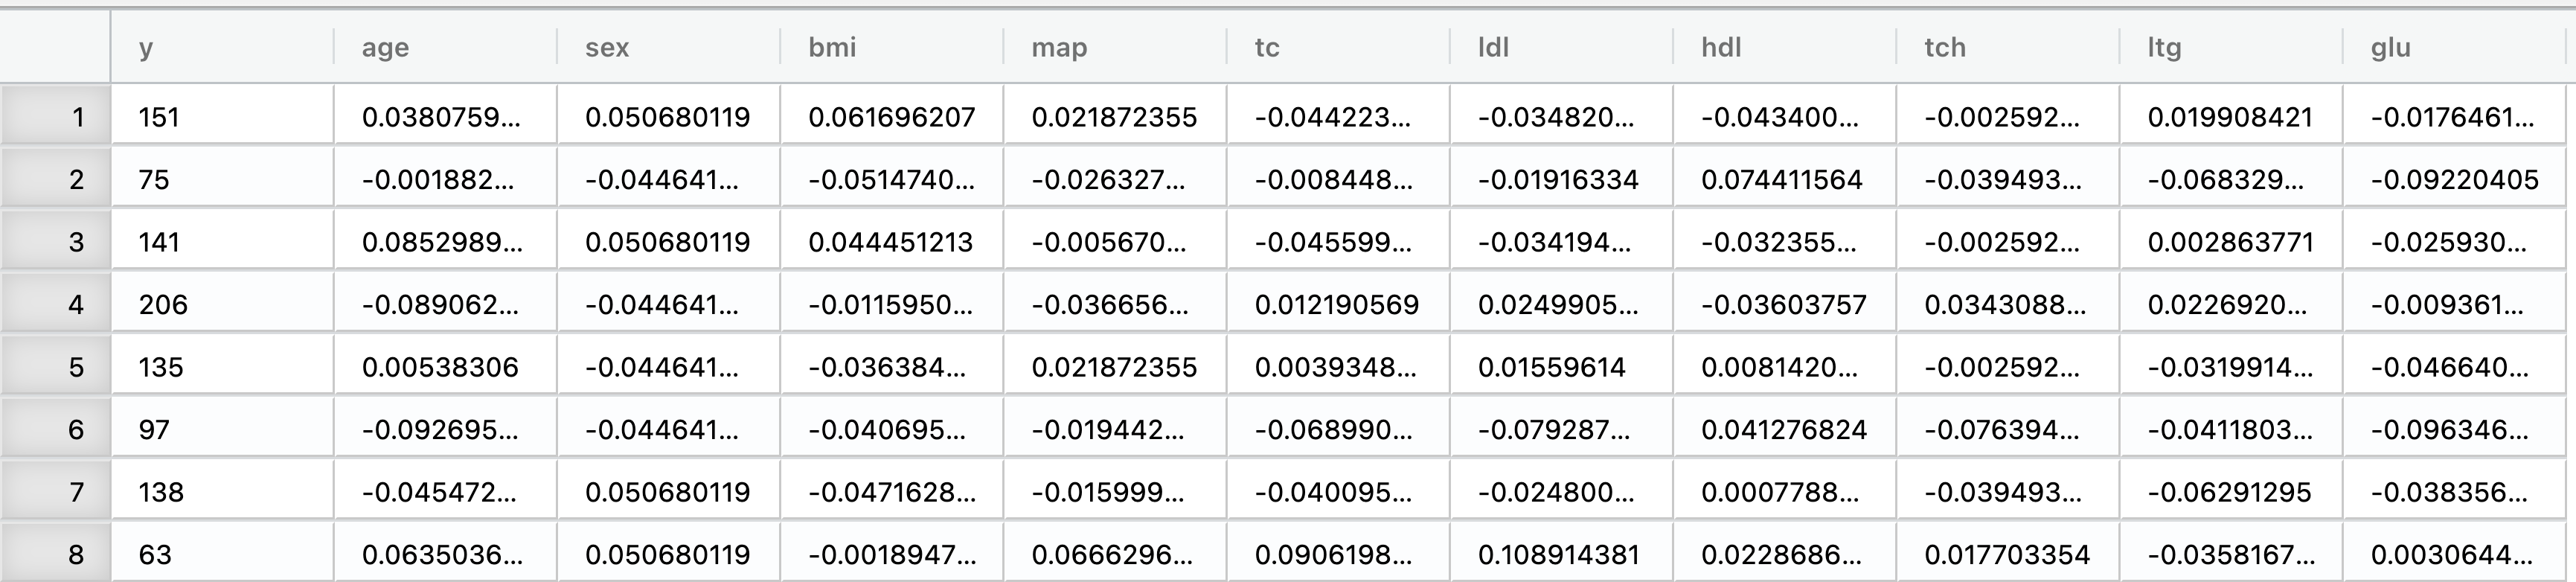
To give an example of a ridge regression we use the diabetes dataset dataset that were first used in Efron et al. (2004) to compare regression methods such as least squares, ridge regression, and the lasso. This dataset is available in the Rguroo Users Guide dataset repository under the name diabetes_Efron.
The diabetes dataset contains baseline measurements for 442 diabetes patients. The predictors are numeric variables representing demographic information, body mass index, blood pressure, and blood serum measurements.
The response variable measures disease progression one year after baseline.
Variables
y: Quantitative measure of disease progression one year after baseline (response)age: Age in yearssex: Sex (coded as a numeric variable)bmi: Body mass indexmap: Mean arterial blood pressuretc: Total serum cholesterolldl: Low-density lipoproteinshdl: High-density lipoproteinstch: Total cholesterol / HDL ratioltg: Possibly log-transformed serum triglyceridesglu: Blood glucose level
Model to be fitted
We will fit a ridge regression model with the response y and all ten predictors:
\[ y = \beta_0 + \beta_1 \, \text{age} + \beta_2 \, \text{sex} + \beta_3 \, \text{bmi} + \beta_4 \, \text{map} + \beta_5 \, \text{tc} + \beta_6 \, \text{ldl} + \beta_7 \, \text{hdl} + \beta_8 \, \text{tch} + \beta_9 \, \text{ltg} + \beta_{10} \, \text{glu} + \varepsilon \]
The ridge penalty will shrink the regression coefficients toward zero, with the amount of shrinkage controlled by the tuning parameter \(\lambda\). The following is a step-by-step guide to performing ridge regression on the diabetes dataset using Rguroo:
Instructions for fitting a linear regression model using ridge in Rguroo:
- Recreate the example below by importing the diabetes_Efron dataset from the Rguroo dataset repository called Rguuroo Users Guide into your account.
Click here to see a portion of the dataset.
Open the Prediction-Classification toolbox on the left-hand side of the Rguroo window. Use the
Analysisdropdown menu and choose Linear Regression —> Ridge Regression. This will open the Ridge Regression dialog box (see Figure 17.4).Select the diabetes_Efron dataset.
In the Model Specification section, select y response variable from the Response drop down.
In the Model Formula textbox, add your predictors. For this example, the model is
age + sex + bmi + map + tc + ldl + hdl + tch + ltg + glu. (For details on how to specify a model see Section 15.1.)(Optional) Click the
 to select or add additional options for obtaining an optimal lambda and setting lambda.
- In the Select Optimal Lambda section, you can choose to use k-fold cross-validation with various metrics or generalized cross-validation (GCV) to select the optimal lambda value. You can also specify the number of folds and a random seed. For this example, we will use 10-fold cross-validation with RMSE as the metric. We have set the seed to 100 for reproducibility.
- In the Set Lambda tab, you can specify a single lambda value or a range of candidate lambda values. You can also create a grid of lambda values based on minimum and maximum values as described in section 17.1.2. Here we have used the default grid generated by Rguroo.
Click the Preview icon
 to view the result.
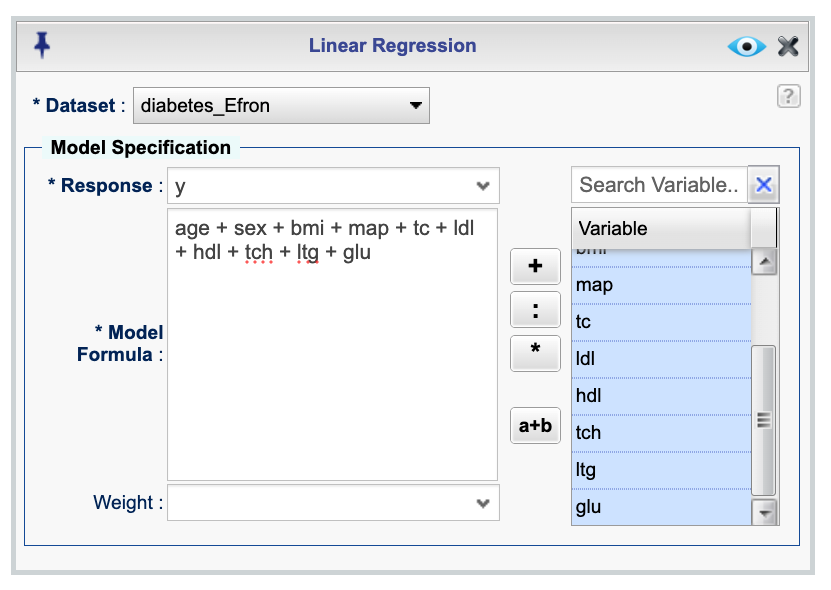
Figure 17.4: Ridge regression dialog for fitting data to the diabetes_Efron dataset
The following is the output of the ridge regression model fitted to the diabetes_Efron dataset, which includes a plot of the coefficient paths,a plot of RMSE values across candidate lambda values, and the parameter estimates for the optimal lambda.