16 Linear Regression: Bootstrap Estimates and Predictions
Bootstrap is a powerful resampling method used to assess the variability and stability of estimated regression coefficients by repeatedly drawing samples with replacement from the original dataset. In the context of linear regression, bootstrap enables users to obtain empirical standard errors, confidence intervals, and distributions for model parameters without relying on normality assumptions. Rguroo provides a user-friendly interface for performing bootstrap in linear regression models, allowing users to specify the number of resamples and explore both graphical and numerical summaries of the bootstrap results. Rguroo also allows you to make predictions using the bootstrap estimates.
16.1 Bootstrap Estimation
To perform bootstrap estimation in Rguroo, begin by selecting Linear Regression from the Prediction–Classification toolbox. Then choose Bootstrap.
To fit a bootstrap model, specify the dataset, response variable, and model formula in the Basics dialog of the bootstrap interface. For detailed instructions on specifying these inputs, see Section 15.1.
Figure 16.1 shows the Bootstrap Estimation dialog, which is accessible through the Details dialog of the Bootstrap function. You can use this dialog to specify the following options:
Number of Bootstrap Samples: The number of bootstrap resamples to generate. The default is 500, but you may enter any reasonable positive integer.
Seed: A positive integer seed for random number generation. Setting a seed ensures reproducibility.
Bootstrap Summary Estimates: If checked (default), includes summary statistics for the bootstrap estimates in the output. The summary table contains parameter estimates along with bootstrap standard errors, percentile confidence intervals, bias, and percent bias. Bias is computed as the difference between the bootstrap estimate and the least squares estimate.
Least Squares Estimates: If checked, includes the least squares estimates in the output. The table lists parameter estimates, standard errors, t-values, p-values, and confidence intervals.
Histogram of Distribution of Bootstrap Estimates: If checked (default), includes a histogram of the distribution of the bootstrap estimates for each parameter.
Confidence Level: The confidence level for both bootstrap and least squares confidence intervals. The default is 0.95 (95%). You may enter any value between 0 and 1.
No. of Decimals for Estimates: The number of decimal places to display for the estimates. Enter any reasonable positive integer; if left blank, a default value is used.
Estimates from Bootstrap Samples: If the Load Table into Viewer checkbox is selected, all estimates from the bootstrap samples are loaded into the viewer. Each column corresponds to a parameter, and each row corresponds to a bootstrap sample estimate. In the viewer, you can filter, sort, and save the dataset or export it as a CSV or Excel file.
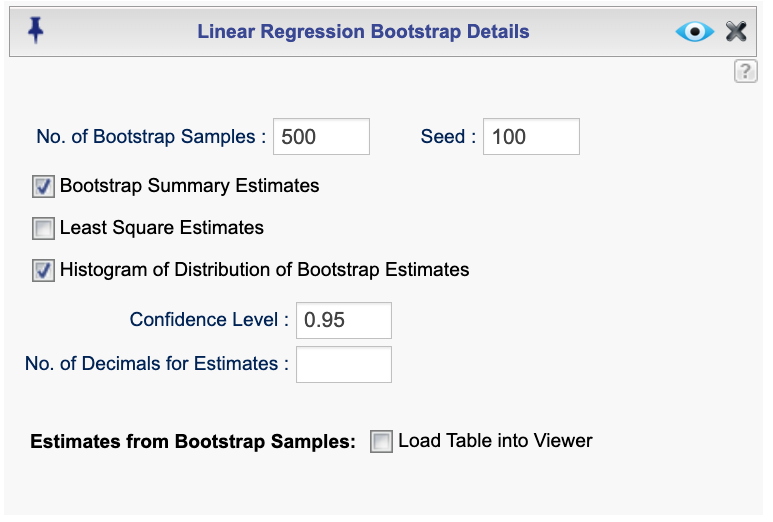
Figure 16.1: Bootstrap estimation dialog
16.2 Bootstrap Prediction and residuals
To obtain bootstrap predictions and residuals for internal data and predictions for external data, select Bootstrap Prediction from the Linear Regression function in the Prediction–Classification toolbox. First, specify the dataset, response variable, and model formula in the Basics dialog. For detailed instructions on specifying these inputs, see Section 15.1.
To set options for the bootstrap estimation and output, click the ![]() button. This opens the Linear Regression Bootstrap Prediction Details dialog, shown in Figure 16.2. In this dialog, you can choose whether to compute fitted values for internal data or predictions for external data. The available options are described below.
button. This opens the Linear Regression Bootstrap Prediction Details dialog, shown in Figure 16.2. In this dialog, you can choose whether to compute fitted values for internal data or predictions for external data. The available options are described below.
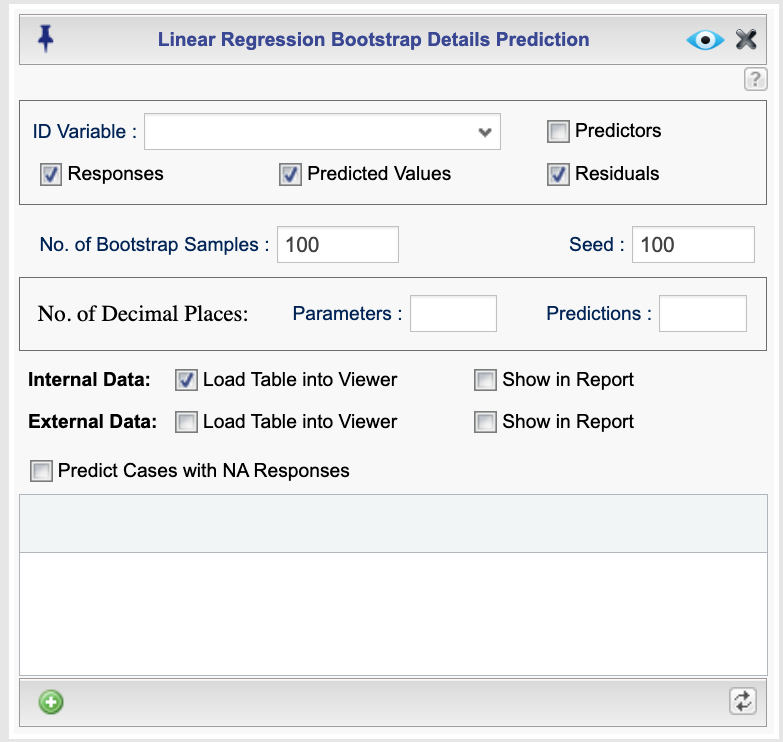
Figure 16.2: Bootstrap Prediction dialog
Output Options
The output will include the bootstrap parameter estimates along with their standard errors, confidence intervals, and bias. You can also choose to include the following columns in the prediction table for each case:
- ID Variable: The variable used to identify each observation. The selected variable will appear in the first column of the output table.
- Predictors: The predictor variables included in the model specified in the Basics dialog.
- Response: The values of the response variable for the cases used to fit the model (internal data).
- Predicted Values: The fitted values for internal data and the predicted values for external data (if any).
- Residuals: The residuals for the cases used to fit the model (internal data).
Additional options include:
- No. of Bootstrap Samples: The number of bootstrap samples used for predictions. The default is 500, but you may enter any reasonable positive integer.
- Seed: A positive integer seed for random number generation. Setting a seed ensures reproducibility.
- No. of Decimal Places: Set the number of decimal places for parameter estimates by entering a value in the Parameters textbox, and for predictions and residuals by entering a value in the Predictions textbox. If left blank, a default value is used.
Internal Data and External Data
- If you check the Load Table into Viewer checkbox next to Internal Data, the fitted values (i.e., predictions) for the cases used to fit the model will be computed and loaded into the viewer.
- If you check the Load Table into Viewer checkbox next to External Data, predictions will be generated for data not used in model fitting.
In both cases, the predicted values will appear in the viewer. The viewer can be used to filter, sort, and save the data as an Rguroo dataset, or to export it as a CSV or Excel file by right-clicking on the dataset.
If you check the Include Table in Report checkboxes next to Internal Data or External Data, the corresponding prediction tables will be included in the Rguroo report.
Specifying External Data
There are two ways to provide external data in Rguroo:
Using the main dataset:
Add external cases directly to the dataset used to fit the model, and set their response variable values toNA. Then check the Predict Cases with NA response box to generate predictions for these cases. Rguroo will treat all cases with NA responses as new observations and compute predictions for them.Using the built-in dataset editor:
After specifying a model, the dataset editor at the bottom of the dialog will display the names of the variables used in your model. You can manually enter values for new cases here:- For numerical variables, type the desired values.
- For categorical variables (factors), click a cell to display a dropdown list of available levels.
By default, the editor shows 5 rows, but you can add more by clicking the plus icon
 at the bottom of the editor. If you update the model and the variables are not appearing, click the refresh icon
  to reload the variable list.
- For numerical variables, type the desired values.