23 Nonparametric Analysis of Variance (Nonparametric ANOVA)
Instructions for performing Nonparametric Analysis of Variance (ANOVA) in Rguroo
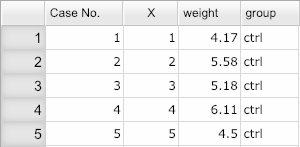
- Use a dataset in your Rguroo account or recreate the example below by importing the PlantGrowthX dataset from the Rguroo dataset repository called Rguroo Users Guide into your account.
Click here to see a portion of the dataset.

Open the Analytics toolbox on the left-hand side of the Rguroo window. Use the
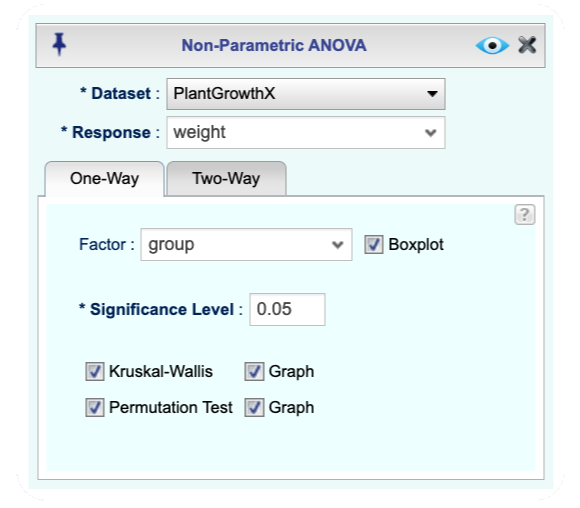
Analysisdropdown menu and choose Non-Parametric ANOVA (see Figure Figure 23.1) .Select a dataset from the Dataset dropdown.
Select your response variable from the Response dropdown.
In the
One-Waytab, select your categorical variable from the Factor dropdown, and type in a significance level.(Optional) Select the Boxplot checkbox to see the boxplots for the selected variable by the levels of the selected factor.
Select one or both methods of Kruskal-Wallis or Permutation Test.
(Optional) If you select the Permutation test, click the
 button to specify the number of Replications and a seed for the random number generator.
Click the Preview icon
 to view the result.

Figure 23.1: Non-Parametric One-Way ANOVA dialog
Instructions for performing Nonparametric Two-Way Analysis of Variance (ANOVA) in Rguroo
- Use a dataset in your Rguroo account or recreate the example below by importing the PlantGrowthX dataset from the Rguroo dataset repository called Rguroo Users Guide into your account.
Click here to see a portion of the dataset.

Open the Analytics toolbox on the left-hand side of the Rguroo window. Use the
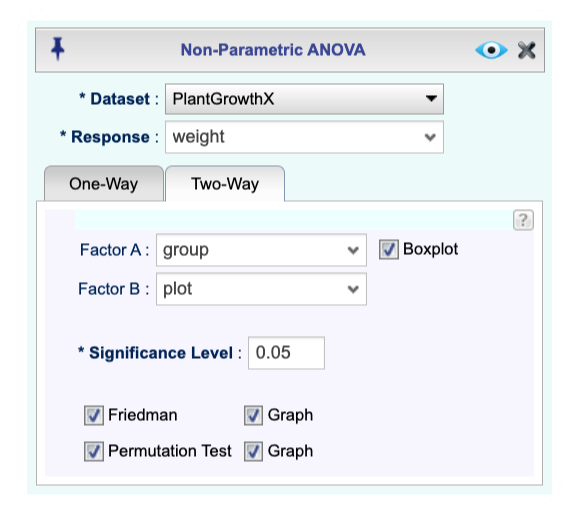
Analysisdropdown menu and choose Non-Paramtric ANOVA (see Figure 23.2) .Select a dataset from the Dataset dropdown, and select your response variable from the Response dropdown.
Click on the
Two-Waytab, select your categorical variables from the Factor A and Factor B dropdowns, and type in a significance level.(Optional) Select the Boxplot checkbox to see the boxplots for the selected variable by the levels of the selected factors.
Select one or both methods of Friedman or Permutation Test.
(Optional) If you select the Permutation test, click the
 button to specify the number of Replications and a seed for the random number generator.
Click the Preview icon
 to view the result.

Figure 23.2: Non-Parametric Two-Way ANOVA dialog