18 Lasso Regression
Lasso regression is a regularization technique used to improve the accuracy and interpretability of linear regression models by adding a penalty term that can shrink some regression coefficients to exactly zero. This allows lasso to perform variable selection in addition to mitigating multicollinearity and overfitting. In Rguroo, lasso regression is implemented with an intuitive interface that allows users to specify either a single value or a range of candidate values for the regularization parameter (lambda). Users can also apply k-fold cross-validation to select an optimal lambda value.
Rguroo provides a user-friendly interface for fitting lasso regression models, visualizing coefficient paths, and evaluating model performance. The output includes plots of coefficient paths and Root Mean Squared Error (RMSE) values across candidate lambda values, along with tables of regression coefficients. Users can also make predictions using the fitted lasso regression model.
18.0.1 Fitting Lasso Regression Models
To perform lasso regression in Rguroo, begin by selecting Linear Regression from the Prediction–Classification toolbox. Then, under the model options, choose Lasso Regression. Next, you need to specify the dataset, the response variable, and the model formula in the Basics dialog of the lasso regression interface. For detailed instructions on how to specify these inputs, see Section 15.1.
Figure 18.1 shows the Lasso Regression dialog, which is accessible through the Details dialog of the Lasso Regression function.
By default, Rguroo generates a sequence (grid) of candidate lambda values used for lasso regression modeling. This grid is automatically determined based on the data and the specified regression model, providing a useful starting point for selecting the optimal regularization parameter. As described in the next section, you also have the option to specify a custom set of lambda values.
The default output includes a plot of the coefficient paths, which shows how regression coefficients change as the lambda value varies. For improved visualization, the horizontal axis is presented on a logarithmic scale. Selecting the Table checkbox adds a table of the coefficients corresponding to each lambda value.
The output also includes a plot of Root Mean Squared Error (RMSE) values for each candidate lambda, computed via k-fold cross-validation. The plot highlights the lambda value that minimizes the RMSE. A corresponding table of regression coefficients for the optimal lambda can optionally be included by selecting the corresponding Table checkbox.
The lasso regression dialog also includes options to specify the convergence tolerance and the maximum number of iterations used during model fitting. The default convergence tolerance is \(10^{-6}\), and the default maximum number of iterations is 1000. These settings can be adjusted as needed to control convergence behavior.
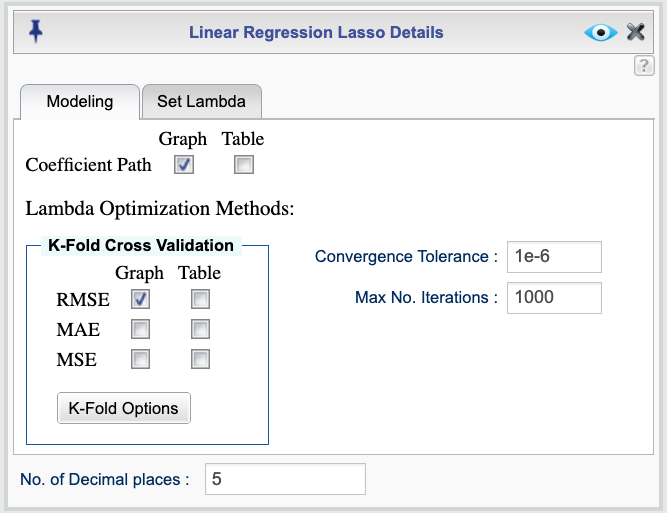
Figure 18.1: Lasso regression dialog
18.0.2 Method for selecting an optimal Lambda
Rguroo provides k-fold cross-validation as the method for selecting an optimal lambda value in lasso regression. The Lasso Regression dialog includes options for evaluating model performance using one or more of the following metrics: Root Mean Squared Error (RMSE), Mean Absolute Error (MAE), or Mean Squared Error (MSE).
For each selected metric, Rguroo generates a plot showing the metric values across the range of candidate lambda values, along with a table listing the corresponding lambda values. The optimal lambda is identified based on the minimum value of the selected metric. You can customize the number of folds and specify a random seed using the K-Fold Options button. By default, Rguroo uses 10 folds with random assignment of observations.
18.0.3 Specifying candidate lambda values
Figure 18.2 shows the Set Lambda tab of the Lasso Regression dialog, which allows you to specify either a single value or a custom range of candidate lambda values for lasso regression. By default, Rguroo automatically generates a sequence of lambda values based on the data and model specified in the Basics dialog. You can override this behavior using either of the methods below:
To specify a single lambda value, enter it in the Lambda textbox. When a single lambda is entered, Rguroo will use this value without generating a sequence. The output will include parameter estimates.
There are two ways to define a custom range of candidate lambda values:
Using the Lambda textbox: You can enter an R expression that generates a sequence of values, such as
seq(0.01, 10, by = 0.1).Using the Create Lambda Grid checkbox: When this option is selected, you can specify the Number of Lambda Values (default is 50), along with Min. Lambda and Max. Lambda. Rguroo then generates a sequence of evenly spaced lambda values within this range. You may also check the Log Scale box to generate the values on a logarithmic scale.
After specifying a range of lambda values, you can apply k-fold cross-validation as described in Section 18.0.2. The resulting output will include the corresponding plots and tables.
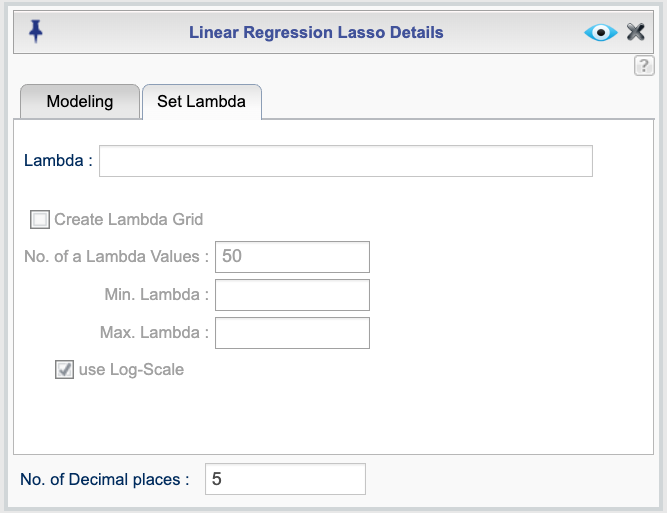
Figure 18.2: Lasso regression dialog for specifying lambda
18.1 Example: Lasso Regression on the Diabetes Dataset
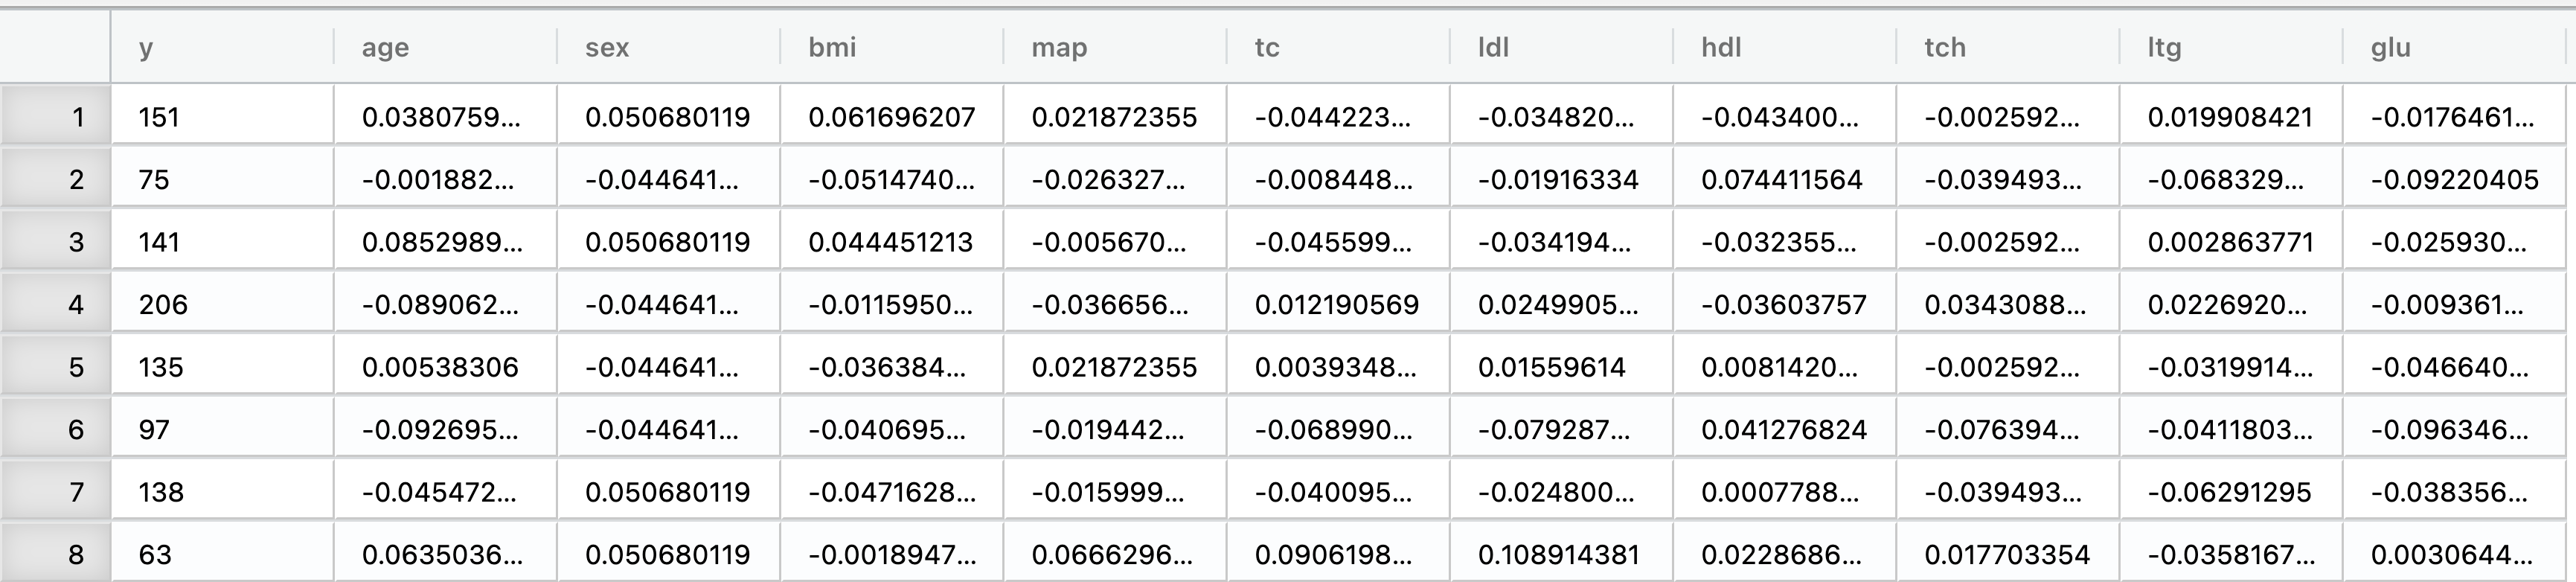
To give an example of a lasso regression we use the diabetes dataset dataset that were first used in Efron et al. (2004) to compare regression methods such as least squares, ridge regression, and the lasso. This dataset is available in the Rguroo Users Guide dataset repository under the name diabetes_Efron.
The diabetes dataset contains baseline measurements for 442 diabetes patients. The predictors are numeric variables representing demographic information, body mass index, blood pressure, and blood serum measurements.
The response variable measures disease progression one year after baseline.
Variables
y: Quantitative measure of disease progression one year after baseline (response)age: Age in yearssex: Sex (coded as a numeric variable)bmi: Body mass indexmap: Mean arterial blood pressuretc: Total serum cholesterolldl: Low-density lipoproteinshdl: High-density lipoproteinstch: Total cholesterol / HDL ratioltg: Possibly log-transformed serum triglyceridesglu: Blood glucose level
Model to be fitted
We will fit a ridge regression model with the response y and all ten predictors:
\[ y = \beta_0 + \beta_1 \, \text{age} + \beta_2 \, \text{sex} + \beta_3 \, \text{bmi} + \beta_4 \, \text{map} + \beta_5 \, \text{tc} + \beta_6 \, \text{ldl} + \beta_7 \, \text{hdl} + \beta_8 \, \text{tch} + \beta_9 \, \text{ltg} + \beta_{10} \, \text{glu} + \varepsilon \]
The lasso penalty will shrink the regression coefficients toward zero, with the amount of shrinkage controlled by the tuning parameter \(\lambda\). The following is a step-by-step guide to performing lasso regression on the diabetes dataset using Rguroo:
Instructions for fitting a linear regression model using lasso in Rguroo:
- Recreate the example below by importing the diabetes_Efron dataset from the Rguroo dataset repository called Rguuroo Users Guide into your account.
Click here to see a portion of the dataset.
Open the Prediction-Classification toolbox on the left-hand side of the Rguroo window. Use the
Analysisdropdown menu and choose Linear Regression —> Lasso Regression. This will open the Lasso Regression dialog box (see Figure 18.3).Select the diabetes_Efron dataset.
In the Model Specification section, select y response variable from the Response drop down.
In the Model Formula textbox, add your predictors. For this example, the model is
age + sex + bmi + map + tc + ldl + hdl + tch + ltg + glu. (For details on how to specify a model see Section 15.1.)(Optional) Click the
 to select or add additional options for obtaining an optimal lambda and setting lambda.
- In the Select Optimal Lambda section, you can choose to use k-fold cross-validation with various metrics or generalized cross-validation (GCV) to select the optimal lambda value. You can also specify the number of folds and a random seed. For this example, we will use 10-fold cross-validation with RMSE as the metric. We have set the seed to 100 for reproducibility.
- In the Set Lambda tab, you can specify a single lambda value or a range of candidate lambda values. You can also create a grid of lambda values based on minimum and maximum values as described in section 18.0.3. Here we have used the default grid generated by Rguroo.
Click the Preview icon
 to view the result.
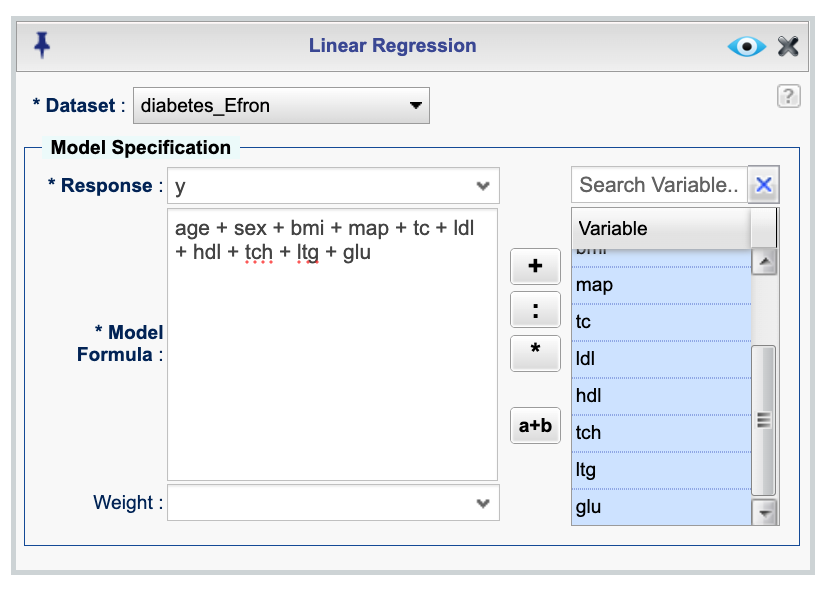
Figure 18.3: Lasso regression dialog for fitting data to the diabetes_Efron dataset
The following is the output of the ridge regression model fitted to the diabetes_Efron dataset, which includes a plot of the coefficient paths,a plot of RMSE values across candidate lambda values, and the parameter estimates for the optimal lambda.