11 Proportion Inference
In this section, we describe how you can use Rguroo to construct confidence intervals and conduct tests of hypotheses for a single population proportion and the difference of two population proportions. You can perform these analyses using both summary statistics and raw data. Rguroo has many methods, including theory-based and simulation-based methods. In this guide, we will show examples of basic methods. You can see all available methods by clicking on the ![]() buttons.
buttons.
11.1 Confidence Interval for a Single Population Proportoion
Instructions for obtaining confidence interval for single population proportion with summary data
Open the Analytics toolbox on the left-hand side of the Rguroo window. Use the
Analysisdropdown menu and choose Proportion Inference —> One Population. The Proportion Inference dialog will open (see Figure 11.1).In the box labeled Factor, type a label for the categorical variable. For this example, we typed \(\color{darkred}{\texttt{Health Status}}\).
In the box labeled Success, type a label for success. For this example, we typed \(\color{darkred}{\texttt{Healthy}}\).
(Optional) Fill in the box labeled Failure Label. Note that this is a box next to the Frequency dropdown. For this example, we typed \(\color{darkred}{\texttt{Sick}}\).
Fill in the Sample Size and # of Successes .
In the section Confidence Interval, type in the confidence level and choose a method.
Click the Preview icon
 to view the result.
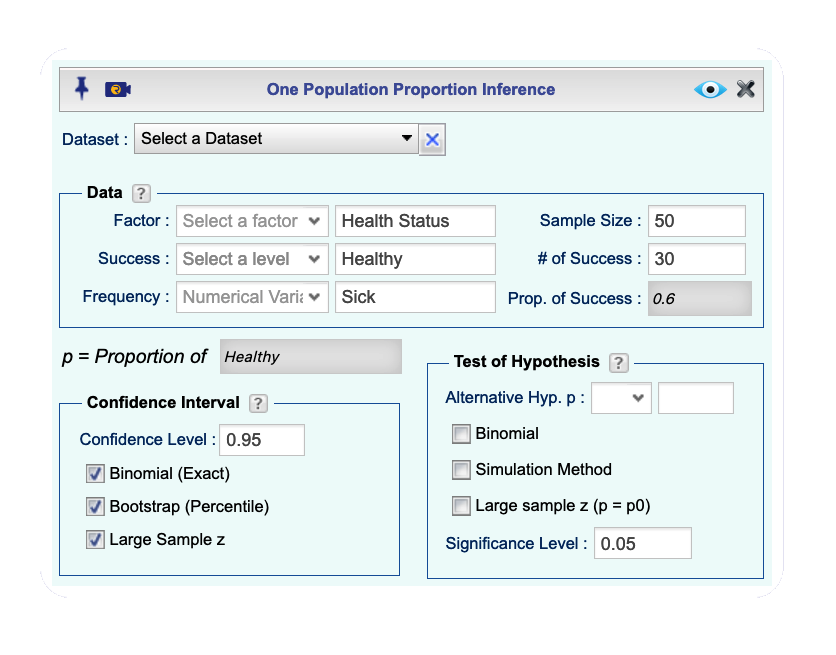
Figure 11.1: Proportion Inference dialog.
11.1.2 With raw data
Instructions for obtaining confidence interval for single population proportion with raw data
- Use a dataset in your Rguroo account or recreate the example below by importing the Cowles dataset from the Rguroo dataset repository called car into your account.
Click here to see a portion of the dataset.

Open the Analytics toolbox on the left-hand side of the Rguroo window. Use the
Analysisdropdown menu and choose the Proportion Inference —> One Population. The Proportion Inference dialog will open (see Figure 11.2).Select a Dataset, Factor variable and Success level. The summary statistics will be automatically populated.
Under the Confidence Interval section, set the Confidence Level and select one or more of the methods Binomial (Exact), Bootstrap, or Large Sample z.
Click the Preview icon
 to view the result.
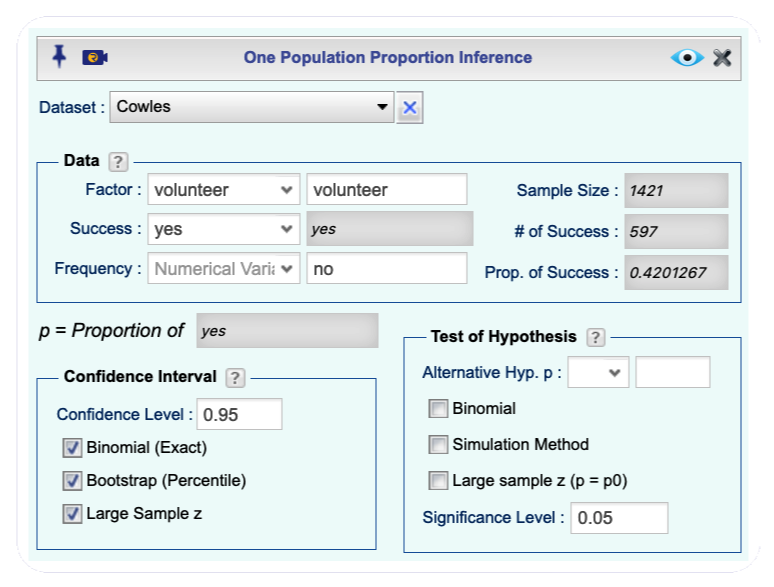
Figure 11.2: Proportion Inference dialog.
11.2 Confidence Interval for Difference of Two Population Proportions
11.2.1 With summary statistics
Instructions for obtaining confidence interval for difference of two population proportions with summary data
Open the Analytics toolbox on the left-hand side of the Rguroo window. Use the
Analysisdropdown menu and choose Proportion Inference —> Two Populations. The Two Population Proportion Inference dialog will open (see Figure 11.3).In the Response Label textbox, type a label for the response variable. For our example, we typed \(\color{darkred}{\texttt{Feeling Better}}\).
In the Success Label textbox, type a label for the success. For our example, we typed \(\color{darkred}{\texttt{yes}}\).
(Optional) In the Failure textbox, type a label for the failure. For our example, we typed \(\color{darkred}{\texttt{no}}\).
In the Population section, type a Population Label. For our example, we typed \(\color{darkred}{\texttt{Patients}}\).
In the Population 1 section in the
Summarytab, type in a Label, Sample Size, and # of Successes for population 1. For our example, we typed \(\color{darkred}{\texttt{Treatment, 30, 21}}\), respectively.In the Population 2 section in the
Summarytab, type in a Label, Sample Size, and # of Successes for population 2. For our example, we typed \(\color{darkred}{\texttt{Control, 50, 30}}\), respectively.Click on the
Confidence Intervaltab, type in a value for the Confidence Level, and select one or more of the methods Large Sample z, Bootstrap (Percentile) or Wilson Score.Click the Preview icon
 to view the result.
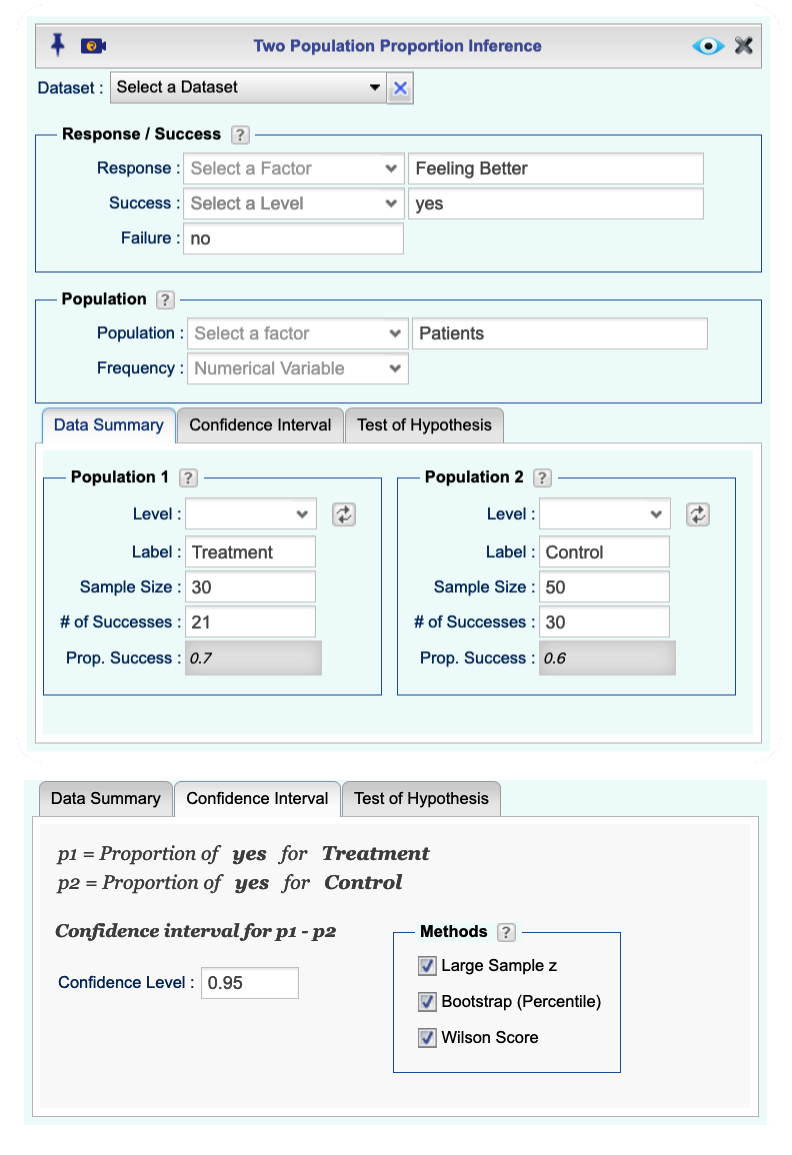
Figure 11.3: Two Population Proportion Inference dialog.
11.2.2 With raw data
Instructions for obtaining confidence interval for difference of two population proportions with raw data
- Use a dataset in your Rguroo account or recreate the example below by importing the cardata dataset from the Rguroo dataset repository called Rguroo Users Guide into your account.
Click here to see a portion of the dataset.

Open the Analytics toolbox on the left-hand side of the Rguroo window. Click on the
Analysisdropdown menu and select Proportion Inference —> Two Populations.Select a Dataset. Under the Response/Success section, select a Response variable and a level corresponding to Success. In our example, we selected CLASS as a response variable and Sport as the level indicating success.
From the Population dropdown in the Population section, select a variable that indicates population. In our example, we selected Type.
(Optional) If data are in the form of a frequency table, select the Frequency variable.
In the Population 1 and Population 2 sections in the
Data Summarytab, select the levels representing the populations from their respective Level dropdowns. In our example, we selected Domestic cars for population 1 and Import for population 2. The summary statistics will be automatically populated.Open the Confidence Interval tab. Set a Confidence Level and select one or more of the methods Large Sample z, Bootstrap (Percentile) or Wilson Score.
Click the Preview icon
 to view the result.
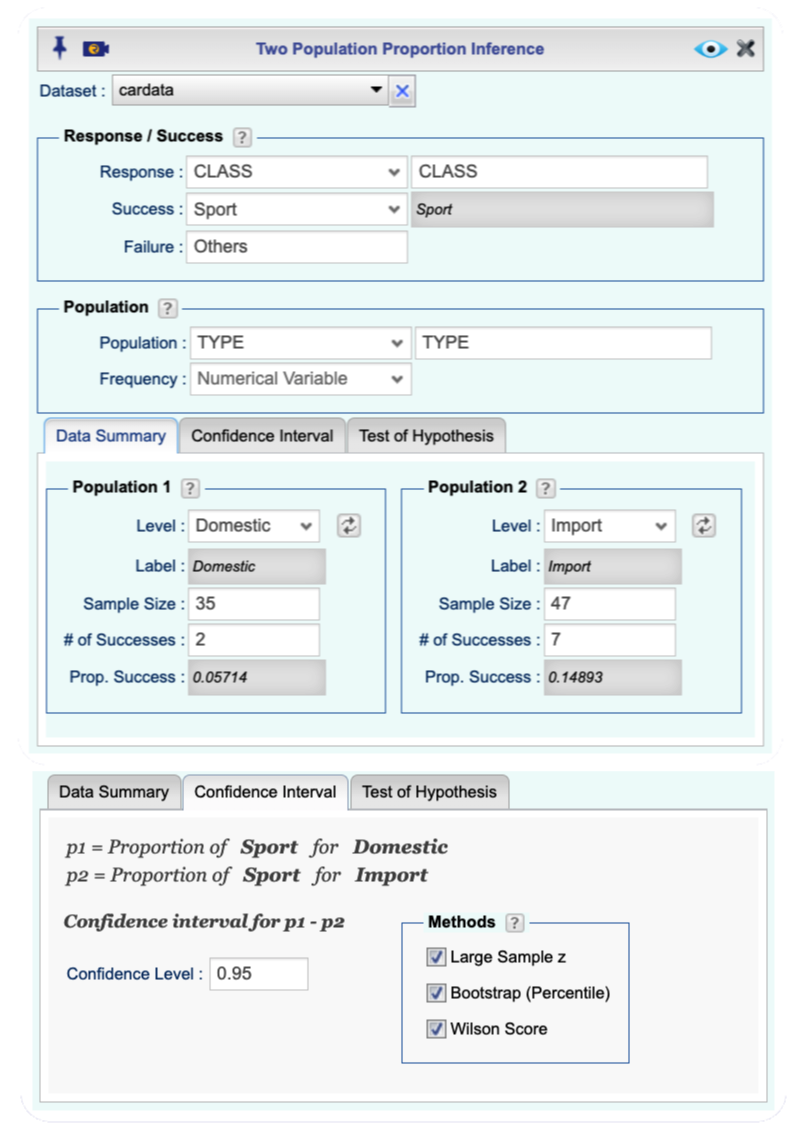
Figure 11.4: Two Population Proportion Inference dialog.
11.3 Test of Hypothesis for a Single Population Proportion
11.3.1 Using summary statistics
Instructions for conducting a test of hypothesis for a single population proportion with summary data
Open the Analytics toolbox on the left-hand side of the Rguroo window. Use the
Analysisdropdown menu and choose the Proportion Inference —> One Population. The Proportion Inference dialog will open (see Figure 11.5).Type in a Factor Label and Success Label. Enter the Sample Size and # of Successes.
Under the Test of Hypothesis section, specify your Alternative hypothesis, select a method by checking one or more of the checkboxes Binomial, Simulation Method, or Large Sample z (p = p0). Also, set a Significance Level.
Click the Preview icon
 to view the result.
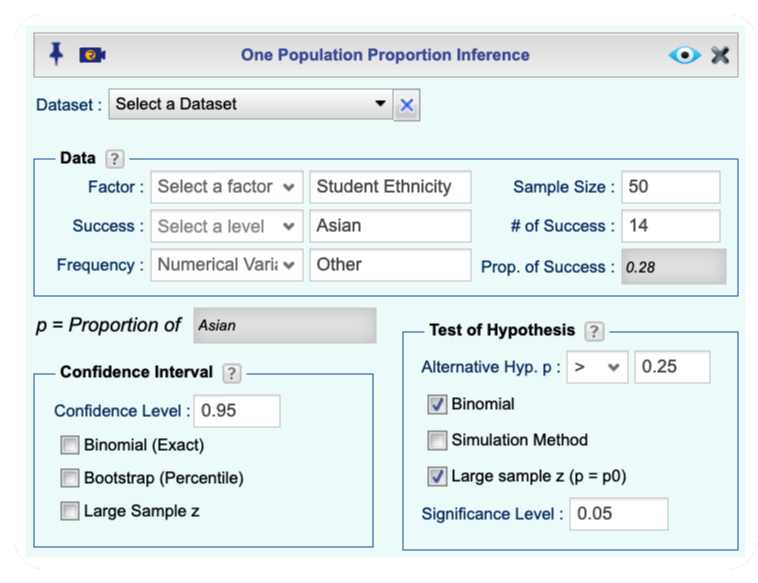
Figure 11.5: One Population Proportion Inference dialog.
11.3.2 Using raw data
Instructions for conducting a test of hypothesis for a single population proportion with raw data
- Use a dataset in your Rguroo account or recreate the example below by importing the Cowles dataset from the Rguroo dataset repository called car into your account.
Click here to see a portion of the dataset.

Open the Analytics toolbox on the left-hand side of the Rguroo window. Use the
Analysisdropdown menu and choose the Proportion Inference —> One Population. The Proportion Inference dialog will open (see Figure 11.6).Select a Dataset, a Factor variable, and the Success level. The summary statistics will be automatically populated.
Under the Test of Hypothesis section, specify your Alternative hypothesis, select a method by checking one or more of the checkboxes Binomial, Simulation Method, or Large Sample z (p = p0). Also, set a Significance Level.
Click the Preview icon
 to view the result.
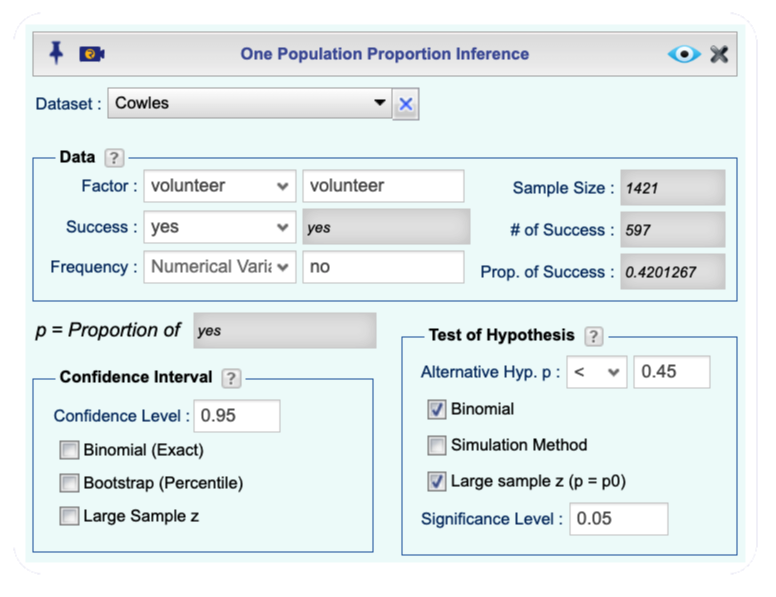
Figure 11.6: One Population Proportion Inference dialog.
11.4 Test of Hypothesis about Difference of Two Population Proportions
11.4.1 Using summary statistics
Instructions for conducting a test of hypothesis for the difference of two population proportions with summary data
Open the Analytics toolbox on the left-hand side of the Rguroo window. Use the
Analysisdropdown menu and choose Proportion Inference —> Two Populations. The Two Population Proportion Inference dialog will open (see Figure 11.7).In the Response/Success section, type in a Response Label, Success Label, and optionally Failure Label.
In the Population section, type in a Population Label.
In the
Data Summarytab, enter the following for each of Populations 1 and 2: Label, Sample Size, and # of Successes. The proportion of successes auto-fills.Click the
Test of Hypothesistab. Specify your Alternative Hypothesis for the difference of proportions \(p_1 - p_2\), type in a Significance Level, and in the Methods section, select one or more of the methods Large Sample z, Permutation Test, or Fisher Exact Test.Click the Preview icon
 to view the result.
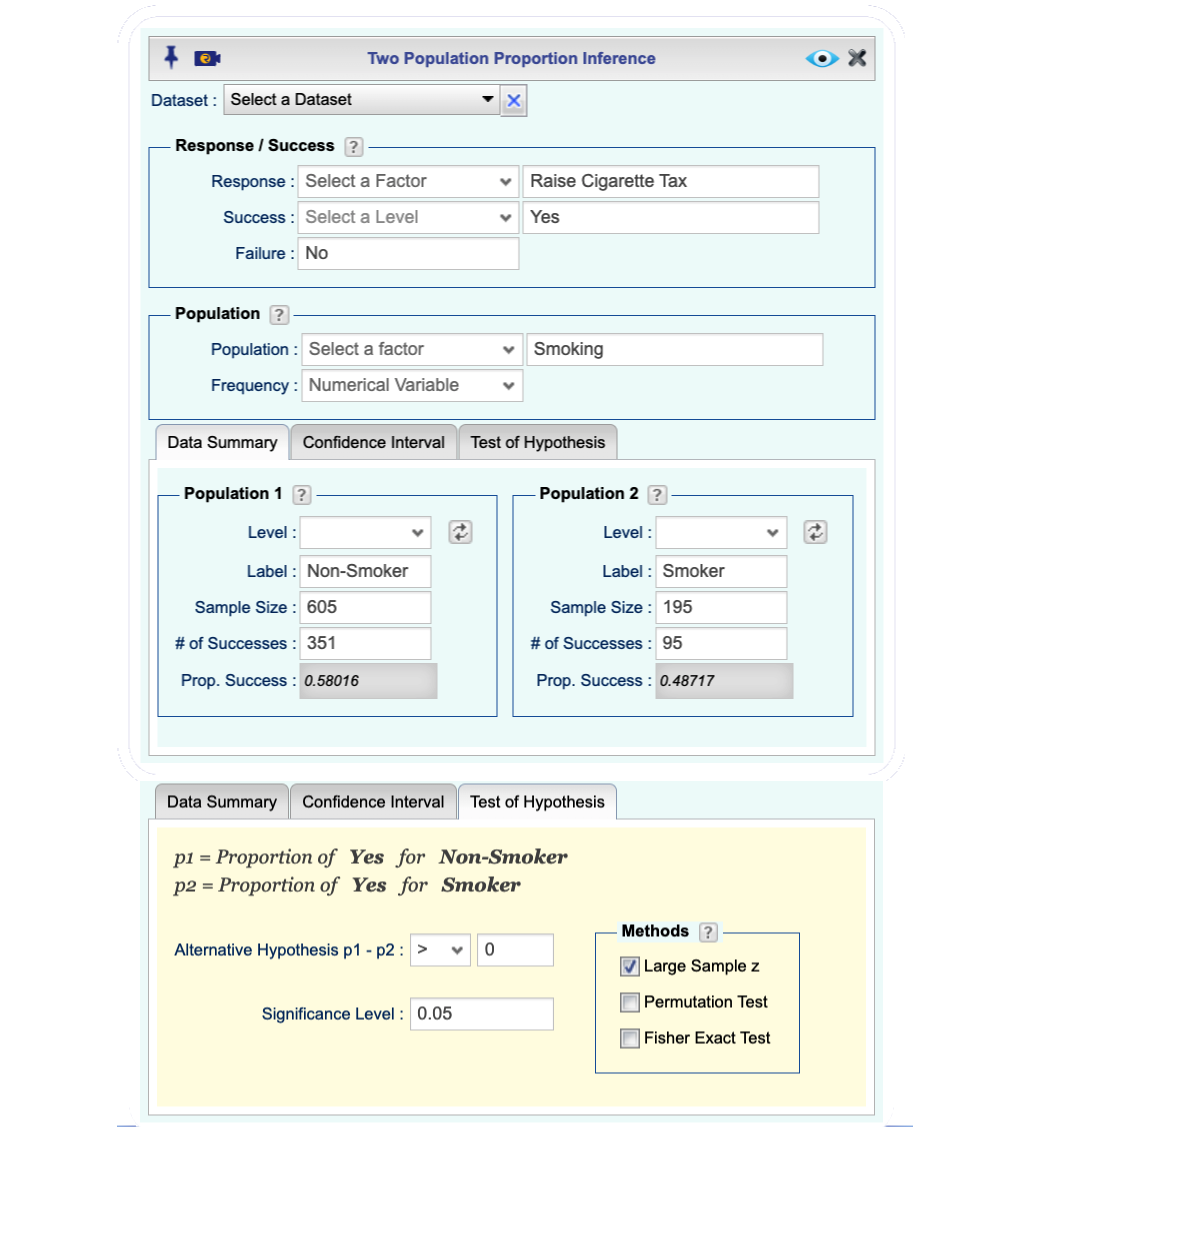
Figure 11.7: Two Population Proportion Inference dialog.
11.4.2 Using raw data
Instructions for conducting a test of hypothesis for the difference of two population proportions with raw data
- Use a dataset in your Rguroo account or recreate the example below by importing the cardata dataset from the Rguroo dataset repository called Rguroo Users Guide into your account.
Click here to see a portion of the dataset.

Open the Analytics toolbox on the left-hand side of the Rguroo window. Use the
Analysisdropdown menu and choose Proportion Inference —> Two Populations. The Two Population Proportion Inference dialog will open (see Figure 11.8).Select a Dataset.
In the Response/Success section, select a Response variable, and the Success level.
In the Population section, select your Population variable. If data are in tabular form so that the number of observations is given in a frequency variable, then select the variable containing the frequencies from the Frequency dropdown.
In the
Data Summarytab, use the Level dropdowns to select the levels that indicate Population 1 and Population 2. In our example, ‘Domestic’ and ‘Import’ are selected as Population 1 and Population 2, respectively. By clicking on the refresh buttons, the summary statistics for each population will show.Click the
Test of Hypothesistab. Specify your Alternative Hypothesis for the difference of proportions \(p_1 - p_2\), type in a Significance Level, and in the Methods section, select one or more of the methods Large Sample z, Permutation Test, or Fisher Exact Test.
8.Click the Preview icon ![]() to view the result.
to view the result.
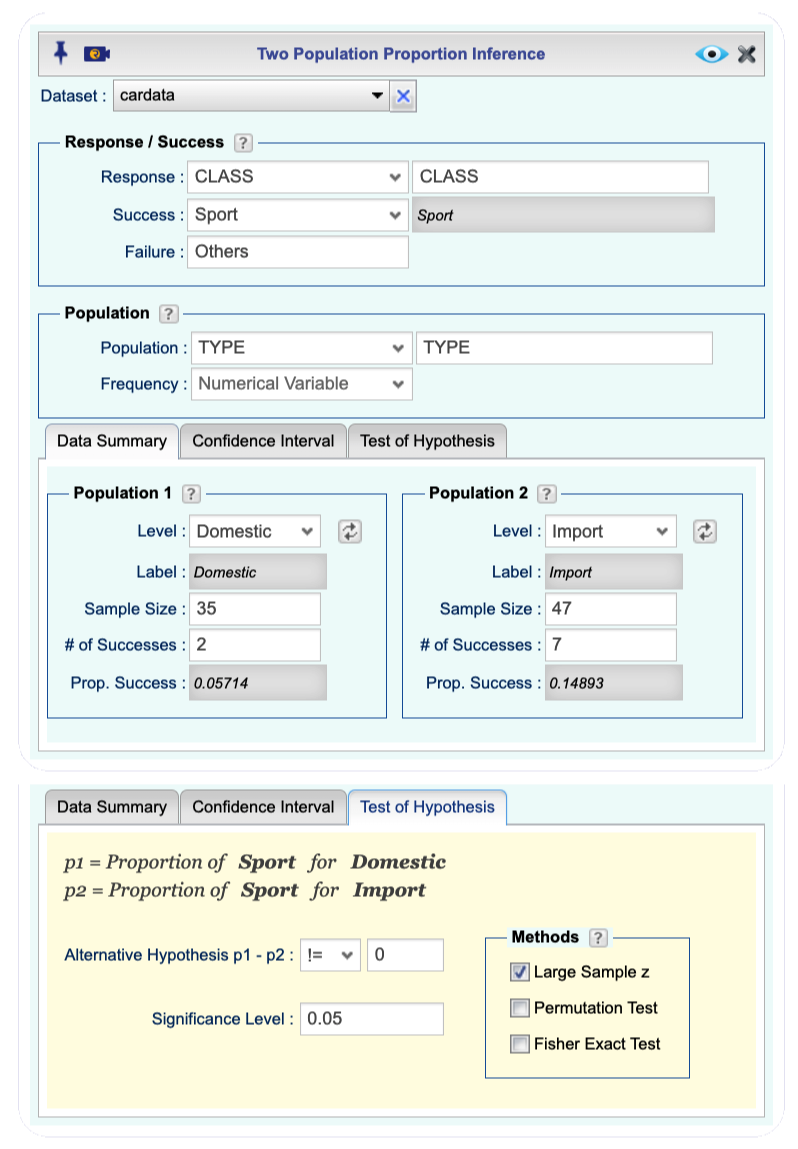
Figure 11.8: Two Population Proportion Inference dialog.