One Population Proportion InferenceData Summary
Counts and Percentages: Health Status
| - | Healthy | Sick | Total |
| Count | 30 | 20 | 50 |
| Percentage | 60 | 40 | 100 |
Confidence Interval: Health Status
Success = Healthy
Sample Size = 50
Number of Successes = 30
Proportion of Successes = 0.6
Confidence level = 95%
| Method | Midpoint | Std Error | Lower CL | Upper CL | Width |
| Binomial (Exact) | 0.595891 | 0.069282 | 0.459751 | 0.732031 | 0.27228 |
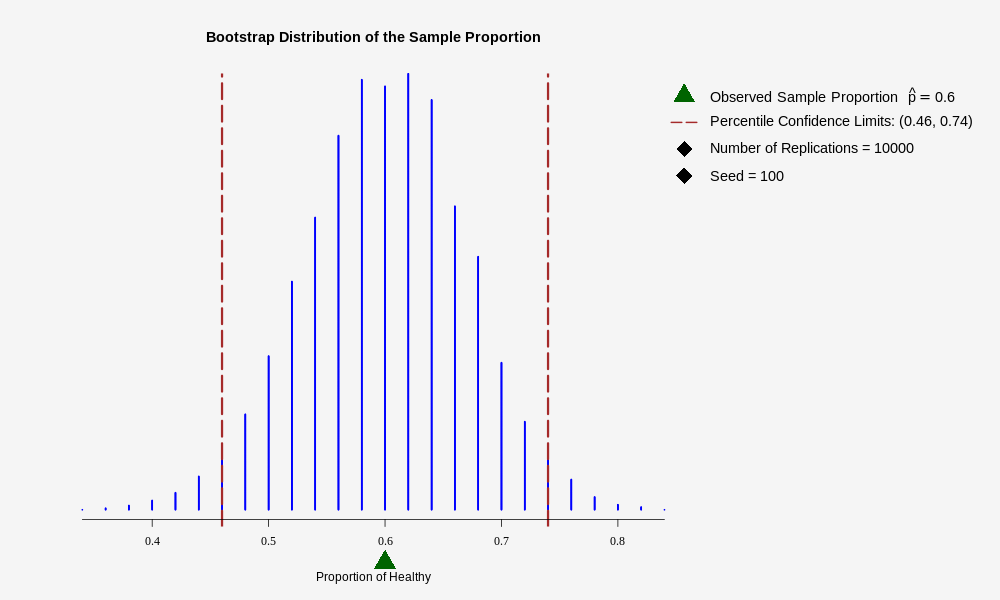
| Bootstrap (Percentile) | 0.6 | 0.069138 | 0.46 | 0.74 | 0.28 |
| Large Sample z | 0.6 | 0.069282 | 0.46421 | 0.73579 | 0.271581 |
- Number of Simulations = 10000
- Random Number Generator Seed = 100
Bootstrap Confidence Interval Graph: Health Status
