One Population Proportion InferenceData Summary
Counts and Percentages: volunteer
| - | yes | no | Total |
| Count | 597 | 824 | 1421 |
| Percentage | 42.01267 | 57.98733 | 100 |
Test of Hypothesis: volunteer
Method: Binomial Exact Test
Alternative Hypothesis Ha: Proportion of 'yes' is less than 0.45
| Sample Size | No. of Successes | Sample Proportion | P-Value | BFB |
| 1421 | 597 | 0.420127 | 0.0125125 | 6.71096 |
- Test is significant at 5% level.
- Bayes Factor Bound (BFB): The data imply the odds in favor of
the alternative hypothesis is at most 6.71 to 1, relative to the null hypothesis.
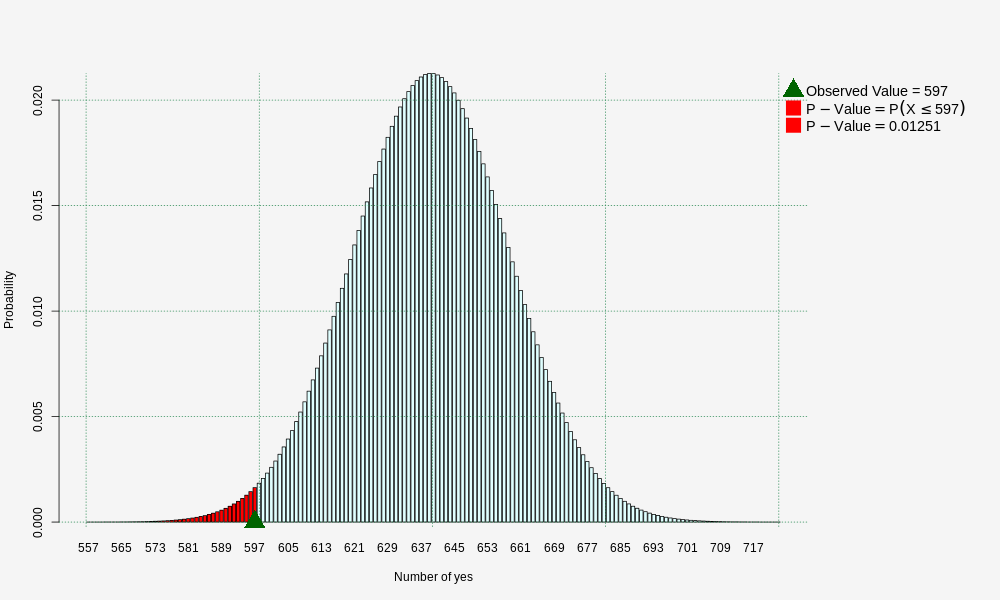
P-Value Graph: volunteer
Method: Exact Binomial Test
Null Distribution: Binomial; n = 1421, p = 0.45
Alternative Hypothesis Ha: Proportion of 'yes' is less than 0.45
Test of Hypothesis: volunteer
Method: Large Sample z Test (Using p0)
Alternative Hypothesis Ha: Proportion of 'yes' is less than 0.45
| Sample Proportion | Std Error | Standardized Obs Stat | 5% z-Lower Critical | P-Value | BFB |
| 0.420127 | 0.0131975 | -2.26357 | -1.64485 | 0.0118004 | 7.02202 |
- Test is significant at 5% level.
- Bayes Factor Bound (BFB): The data imply the odds in favor of
the alternative hypothesis is at most 7.02 to 1, relative to the null hypothesis.
P-value Graph: Large Sample z (Using p0)
Null density (in units of data): Normal; mean = 0.45 , sd = 0.013197
Alternative Hypothesis Ha: Proportion of 'yes' is less than 0.45

/div>