20 Goodness of Fit Test
- Chi-Square Goodness of Fit Test
- Chi-Squared Goodness of Fit Test by Simulation
- Power Analysis - Goodness of Fit Test
20.1 Using a dataset
Instruction for goodness of fit test using a dataset
- Use a dataset in your Rguroo account or recreate the example below by importing the Starburst dataset from the Rguroo dataset repository called Rguroo Users Guide into your account.
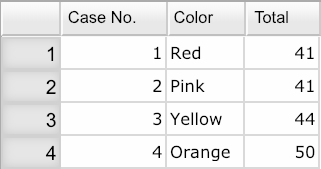
Click here to see a portion of the dataset.

Open the Analytics toolbox on the left-hand side of the Rguroo window. Use the
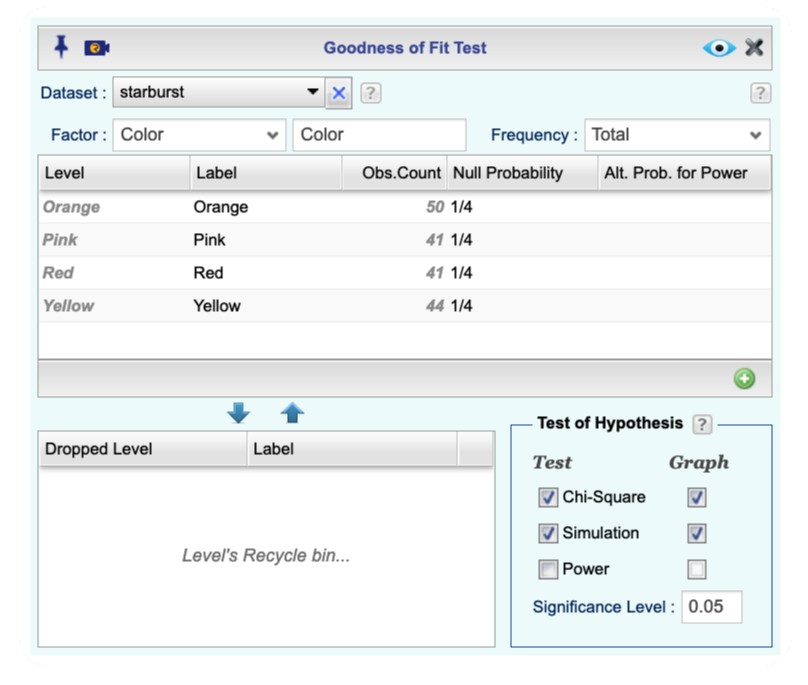
Analysisdropdown menu and choose Goodness of Fit (see Figure 20.1).Select a Dataset, the categorical variable from the Factor dropdown, and if your data is in tabular form where frequencies are given in a separate column, select your Frequency variable. The observed counts appear in the column labeled
Obs. Count.In the column labeled
Null Probability, type in the null hypothesis probability corresponding to each level of the factor variable. A few notes:
- If you leave the
Null Probabilitycolumn blank, by default, equal probabilities are assumed for all levels. - You can use fractions or decimal values for the null probabilities. Moreover, if the null probabilities don’t add up to one, they will be normalized internally to add to one.
Under the Test of Hypothesis section, check one or both of the Chi-Square or Simulation checkboxes (with graph, if desired). Also, set the Significance Level.
Click the Preview icon
 to view the result.

Figure 20.1: Goodness of fit test dialog.
20.2 Entering data manually
Instruction for goodness of fit test by entering data manually
Open the Analytics toolbox on the left-hand side of the Rguroo window. Use the
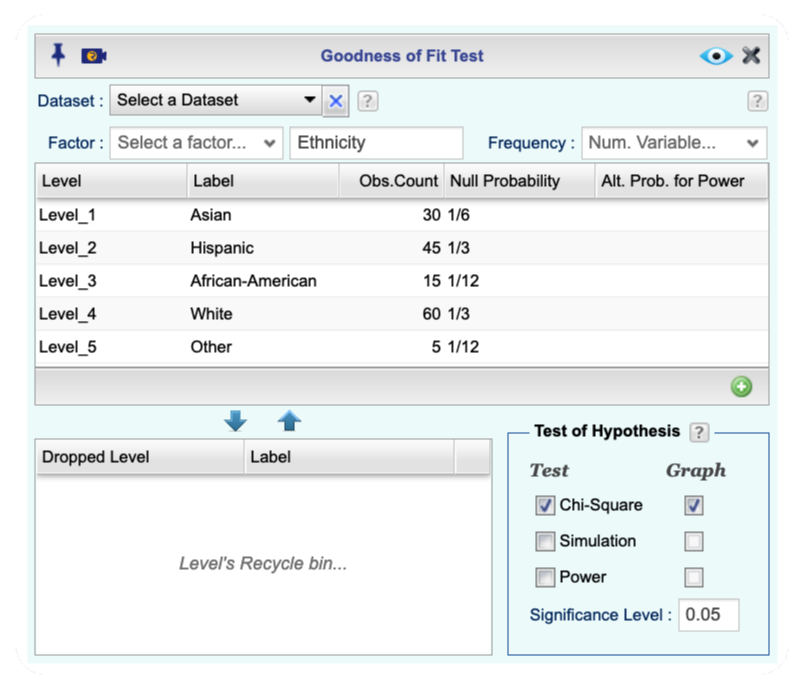
Analysisdropdown menu and choose Goodness of Fit (see Figure 20.2).In the Factor textbox, enter a label for your categorical variable.
Click the green plus button
 to add a category; a row appears. Type in a label and its corresponding count on the columns labeled
 Label, andObs. Count. Repeat this for each level of the categorical variable.In the column labeled
Null Probability, type in the null hypothesis probability corresponding to each level of the factor variable. A few notes:
- If you leave the
Null Probabilitycolumn blank, by default, equal probabilities are assumed for all levels. - You can use fractions or decimal values for the null probabilities. Moreover, if the null probabilities don’t add up to one, they will be normalized internally to add to one.
Under the Test of Hypothesis section, check one or both of the Chi-Square or Simulation checkboxes (with graph, if desired). Also, set the Significance Level.
Click the Preview icon
 to view the result.

Figure 20.2: Goodness of fit test dialog