Data Summary and Diagnostics: Ethnicity
| Ethnicity | Observed Count | Expected Count | Observed Proportion | Expected Proportion |
| Asian | 30 | 25.83 | 0.19355 | 0.16667 |
| Hispanic | 45 | 51.67 | 0.29032 | 0.33333 |
| African-American | 15 | 12.92 | 0.09677 | 0.08333 |
| White | 60 | 51.67 | 0.3871 | 0.33333 |
| Other | 5 | 12.92 | 0.03226 | 0.08333 |
Null probabilities not specified by user set to 0
Chi-Squared Goodness of Fit Test
Research Hypothesis Ha: Population proportions of Ethnicity are different from the expected distribution
| Observed Test Statistic | Degrees of Freedom | P-Value |
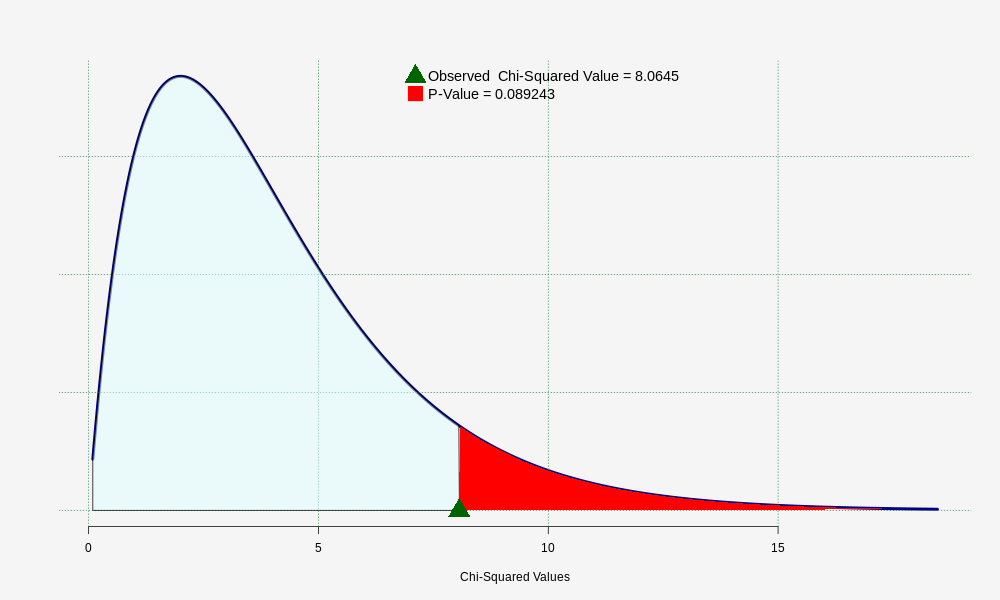
| 8.06452 | 4 | 0.08924 |
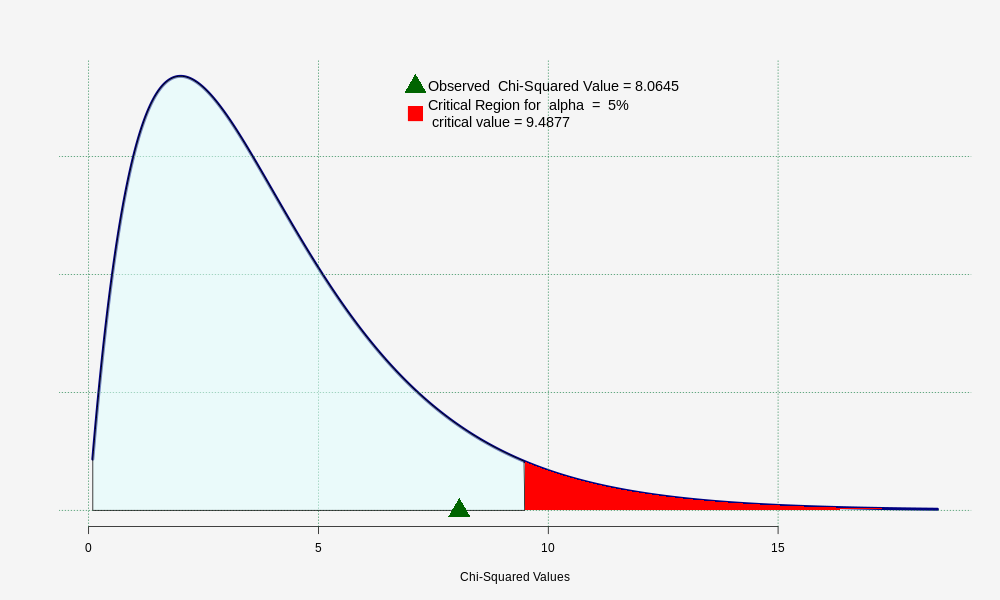
Test is not significant at the 5% significance level
P-Value Graph:
Method: Chi-Squared Goodness of Fit Test
Null Density: Chi-Squared; df = 4
Null Hypothesis H0: The data agree with the proposed distribution of Ethnicity
Critical Region Graph:
Method: Chi-Squared Goodness of Fit Test
Null Density: Chi-Squared; df = 4
Null Hypothesis H0: The data agree with the proposed distribution of Ethnicity

