Data Summary and Diagnostics: Color
| Color | Observed Count | Expected Count | Observed Proportion | Expected Proportion |
| Orange | 50 | 44 | 0.28409 | 0.25 |
| Pink | 41 | 44 | 0.23295 | 0.25 |
| Red | 41 | 44 | 0.23295 | 0.25 |
| Yellow | 44 | 44 | 0.25 | 0.25 |
Null probabilities not specified by user set to 0
Chi-Squared Goodness of Fit Test
Research Hypothesis Ha: Population proportions of Color are different from the expected distribution
| Observed Test Statistic | Degrees of Freedom | P-Value |
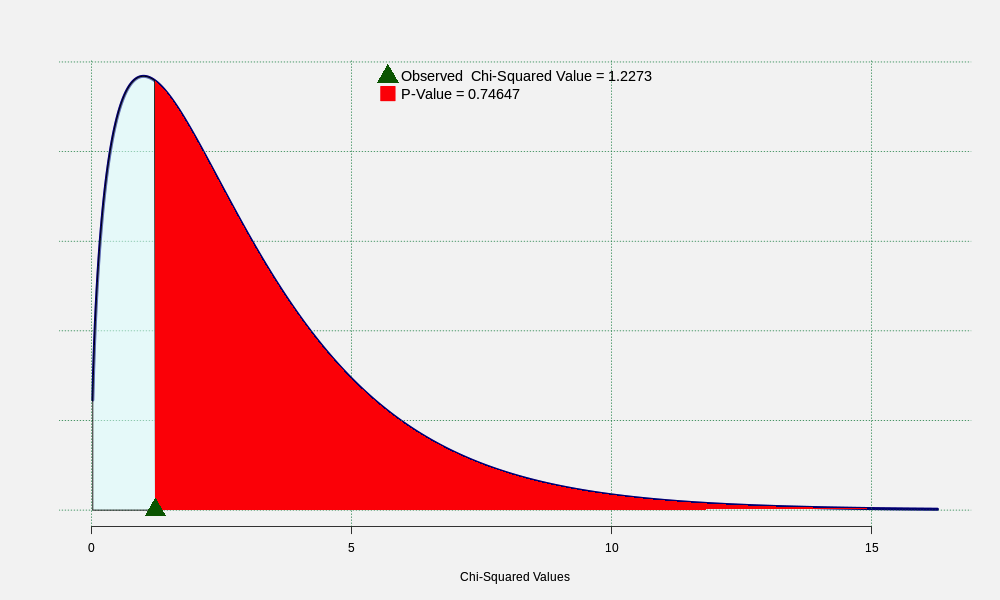
| 1.22727 | 3 | 0.74647 |
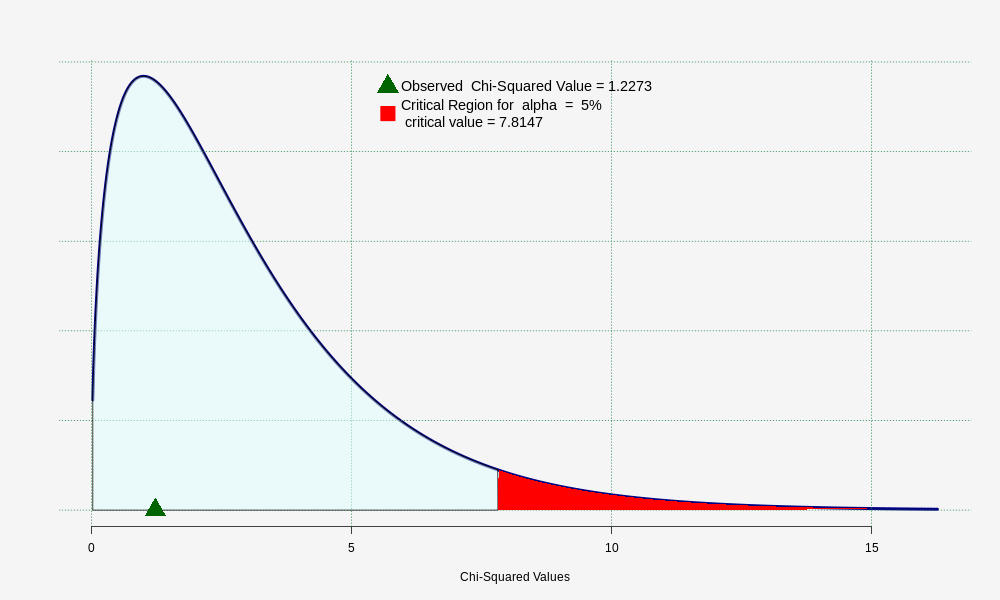
Test is not significant at the 5% significance level
P-Value Graph:
Method: Chi-Squared Goodness of Fit Test
Null Density: Chi-Squared; df = 3
Null Hypothesis H0: The data agree with the proposed distribution of Color
Critical Region Graph:
Method: Chi-Squared Goodness of Fit Test
Null Density: Chi-Squared; df = 3
Null Hypothesis H0: The data agree with the proposed distribution of Color
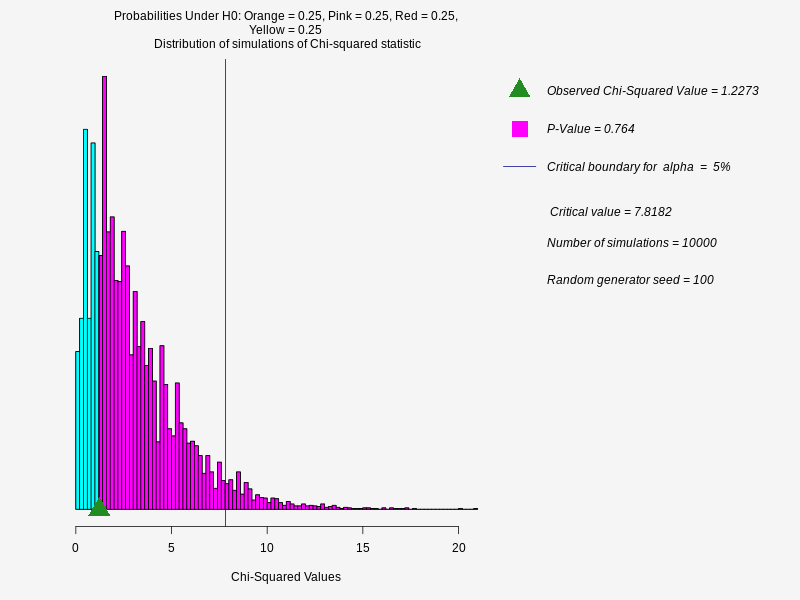
Chi-Squared Goodness of Fit Test by Simulation
Random generator seed = 100
| Observed Test Statistic | P-Value | Number of Simulations |
| 1.22727 | 0.7640 | 10000 |
Test is not significant at the 5% significance level
Chi-Squared Goodness of Fit Test by Simulation: Graph


