7 Summaries of Numerical Variables
A quick summary of variables in a dataset can be obtained using the instructions given in the Quick Summary section. To get specific summaries of numerical variables, you can use the function Summary Statistic under the Data toolbox, or the function is Numerical Summaries under the Analytics toolbox. The Numerical Summaries function computes both univariate and multivariate summary statistics.
You can obtain a quick dataset summary by using the following steps:
Under the Data toolbox, select the dataset that you want to get summaries for.
Right-click (Shift-F10) on a dataset name and select the option Dataset Summary.
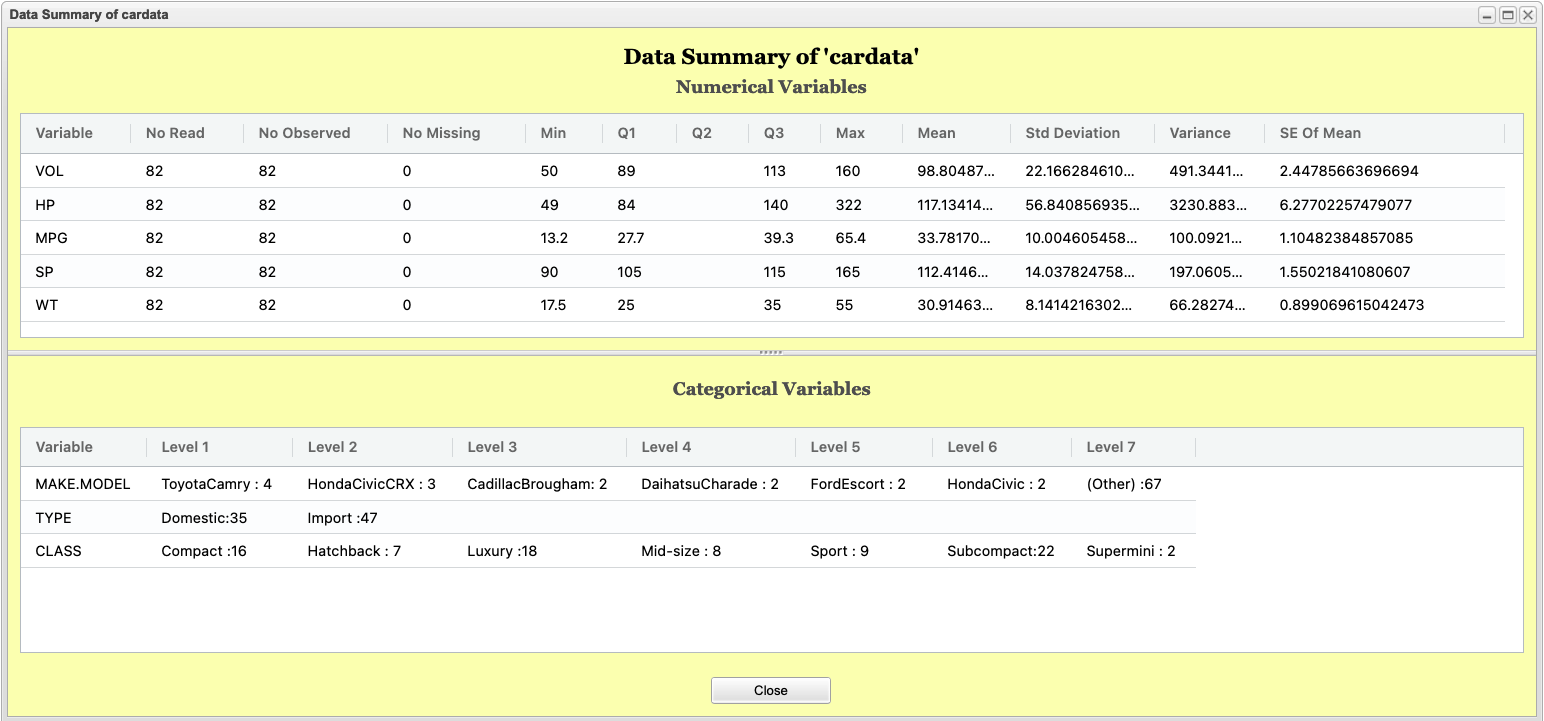
Figure 7.1: An example of a quick dataset summary output
To obtain specific univariate summary statistics, use the Summary Statistic function. This function also has the option of obtaining summary statistics for each level of a categorical variable.
Instructions selecte specific summary statistics for a numerical variable:
- Use a dataset in your Rguroo account or recreate the example below by importing the cardata dataset from the Rguroo dataset repository called Rguroo Users Guide into your account.
Click here to see a portion of the dataset.

Open the Data toolbox on the left-hand side of the Rguroo window. Click on the
Functionsdropdown menu and choose the Summary Statistic function. The Basic Summary Statistic dialog opens.Select your Dataset.
From the Numerical dropdown, select the numerical variable that you like to summarize. (Optional) We have also selected a factor variable from the Factor 1 dropdown menu in this example.
In the Statistics section of the dialog, select the checkboxes for your desired summary statistics.
Click the Preview icon
 to see the summary statistics.
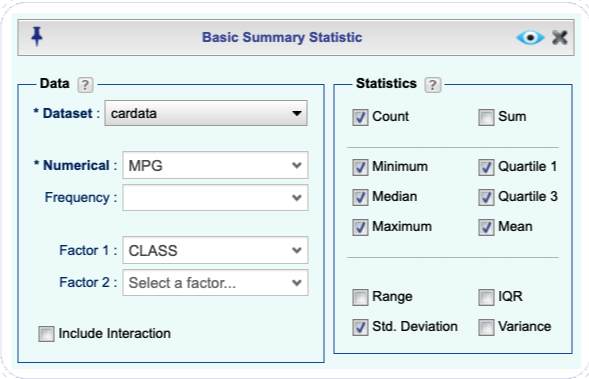
Figure 7.2: The basic Summary Statistic function dialog.
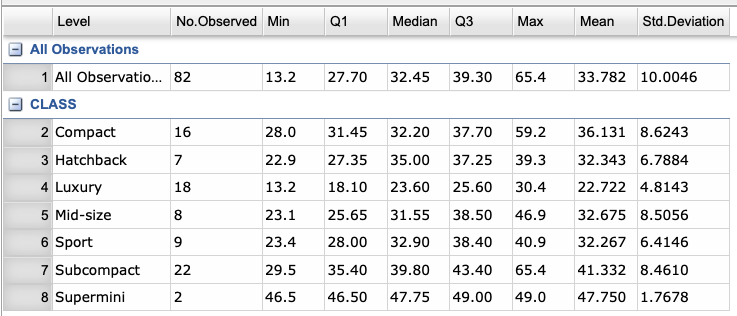
Figure 7.3: An example of a Summary Statistic function output
Summary Statistics by Factor and Frequency (Weight):
- You can get numerical summaries for each level of a factor variable if your dataset includes a categorical (factor) variable by selecting the
Factor 1andFactor 2dropdowns. - You can also get weighted numerical summaries by selecting a weight variable from the
Frequencydropdown.
The Numerical Summaries function computes various univariate and multivariate summary statistics. Multivariate statistics include correlation, covariance, and Cronbach Alpha. You can also obtain these statistics for each level of a factor, if your dataset consists of factor variables.
- Use a dataset in your Rguroo account or recreate the example below by importing the cardata dataset from the Rguroo dataset repository called Rguroo Users Guide into your account.
Click here to see a portion of the dataset.

Open the Analytics toolbox on the left-hand side of the Rguroo window. Click on the
Analysisdropdown menu and choose the Numerical Summaries function.Select the cardata from the Dataset dropdown menu.
Select your variables. In this example, we selected HP and MPG.
Click the button
UnivariateorMultivariatebuttons to select your desired statistics. In this example, we have selected the five-number summary, the 2.5% and 97.5% quantiles, and the multivariate statistic correlation.Click on the preview icon
 .
.
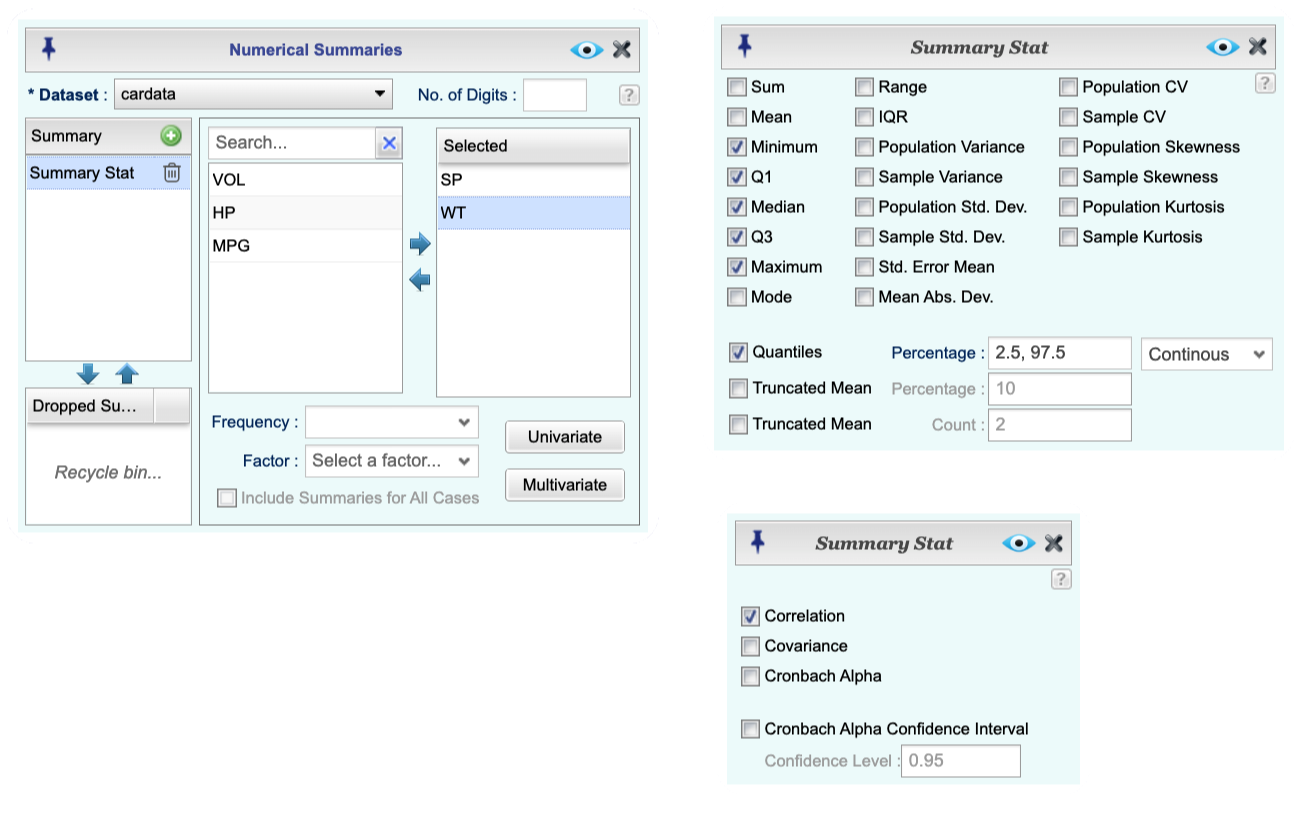
Figure 7.4: The Numerical Summaries function dialog.
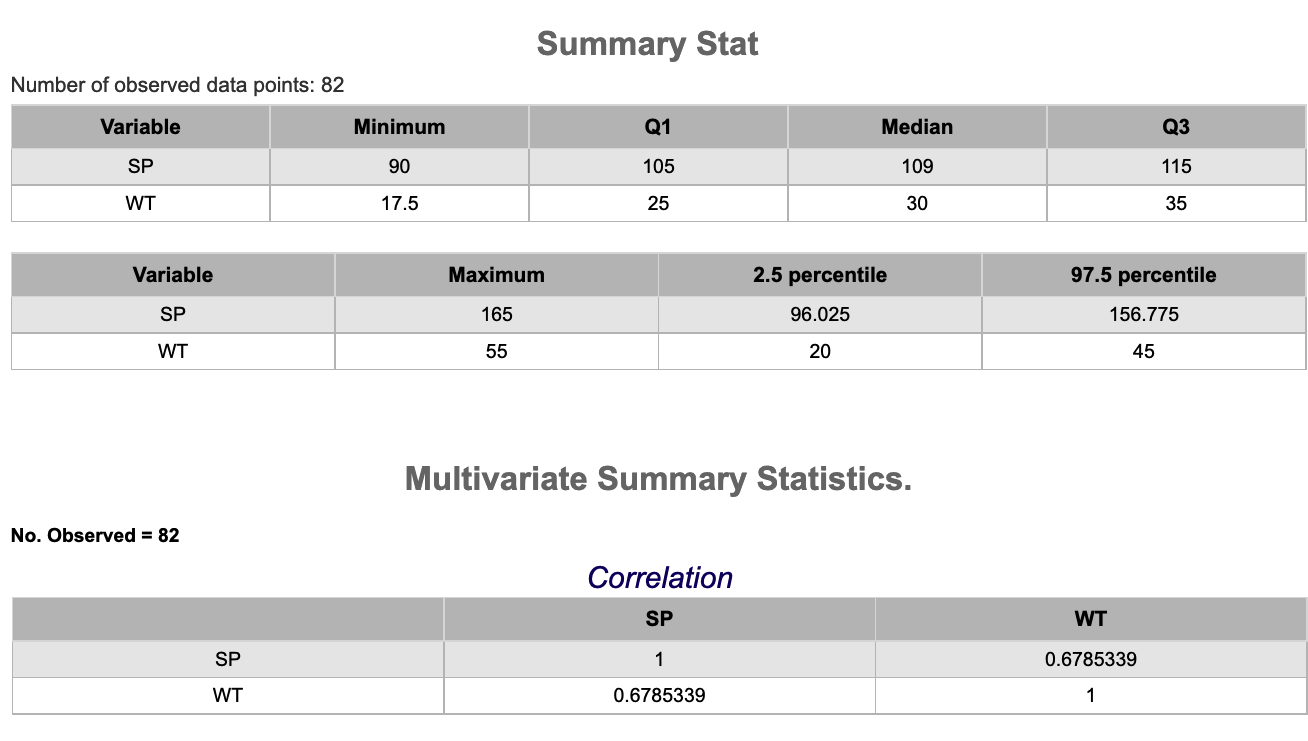
Figure 7.5: An example of a Numerical Summary function output
Multiple summary tables, summary by factoe and frequency, and multivariate summaries:
You can add summary tables and name the summary tables by clicking the plus sign icon
 .
.If your dataset includes categorical (factor) variables, you can get numerical summaries for each level of a factor variable by selecting the Factor dropdown.
You can get weighted mean and in general weighted numerical summaries by selecting a weight variable from the Frequency dropdown.
By clicking on the
Multivariatebutton, you can obtain correlation, variance-covariance, and Cronbach Alpha.