8 Tabulating Categorical and Numerical Data
You can tabulate categorical or numerical variables in Rguroo and create frequency or relative frequency tables. You would use the Tabulation function in the Analytics toolbox to do so. To tabulate numerical data, you can use one of Freedman-Diaconis, Sturges, or Scott algorithms or use various customization options to set the classes (bins).
Steps for Tabulating Categorical Variables:
- Use a dataset in your Rguroo account or recreate the example below by importing the cardata dataset from the Rguroo dataset repository called Rguroo Users Guide into your account.
Click here to see a portion of the dataset.

Open the Analytics toolbox on the left-hand side of the Rguroo window. Click on the
Analysisdropdown menu and choose the Tabulation –> Categorical function. The Data Tabulation dialog opens.Select your dataset from the Dataset dropdown menu. In this example, we select the cardata.
Click the plus icon
 at the top of the first column. Type a name for your table.
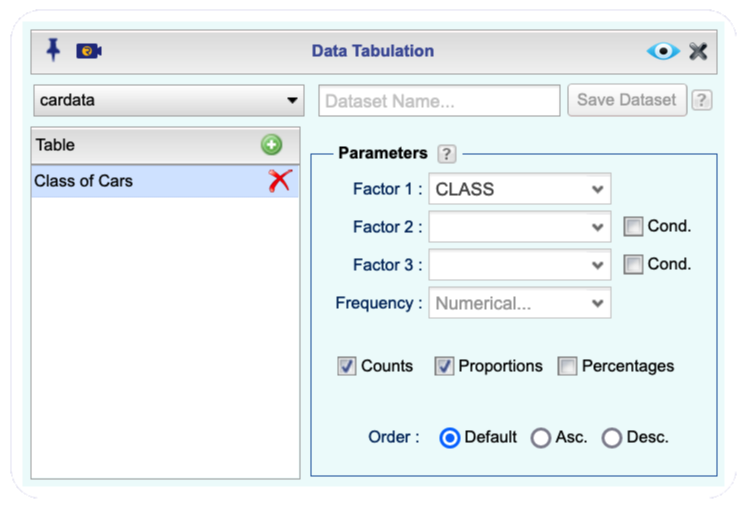
Select the qualitative variable that you want to tabulate from the Factor 1 dropdown.
Select one or more of the options Counts, Proportions, or Percentage.
Click the Preview icon
 to see the result.

Figure 8.1: The Tabulation function dialog.

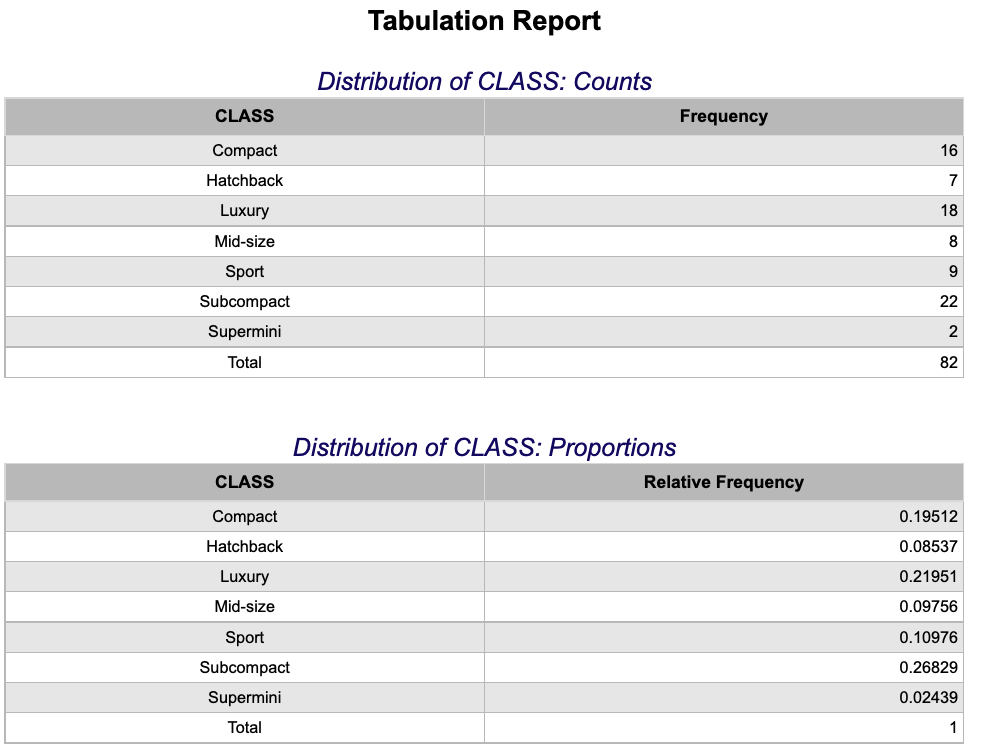
Figure 8.2: An example of a tabulation output.
Additional Options for Tabulating Categorical Variables:
-Click the plus icon ![]() to tabulate additional variables.
to tabulate additional variables.
You can tabulate up to three categorical variables simultaneously using the Factor 1, Factor 2, and Factor 3 dropdowns.
You can compute conditional proportions by selecting the Cond checkbox.
You can add frequencies (weights) by selecting a frequency variable from the
Frequencydropdown.You can use the Level Editor
 to reorder the levels of the categorical variables.
You can save the tables as an Rguroo dataset by using the
Save Datasetoption on the top right.For one-way tables, you can order categories (levels) in ascending or descending order of frequencies. By default, categories (levels) are ordered alphabetically based on their names.
- Use a dataset in your Rguroo account or recreate the example below by importing the cardata dataset from the Rguroo dataset repository called Rguroo Users Guide into your account.
Click here to see a portion of the dataset.

Open the Analytics toolbox on the left-hand side of the Rguroo window. Click on the
Analysisdropdown menu and choose the Tabulation –> Numerical (Binning) function. The Binning dialog opens.By default, a table name is shown in the
Tablecolumn. You can overwrite the name with a title for your table.Select your dataset from the Dataset dropdown menu. In this example, we select the cardata.
From the Variable dropdown, select the numerical Variable for which you like to create a frequency table.
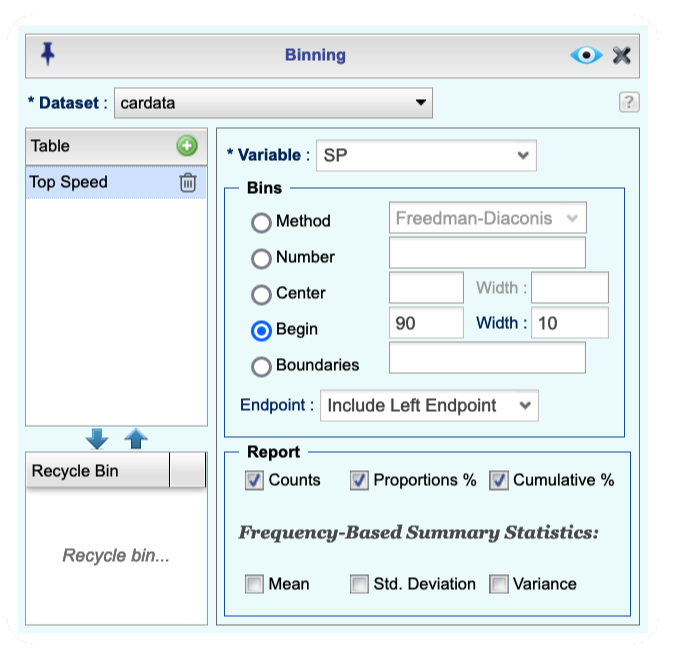
In the Bins section, select a method for binning. For the example shown, the bins start at 90 and have a width of 10.
From the Report section, select one or more options of Counts, Proportions %, or Cumulative %.
Click the Preview icon
 to see the result.

Figure 8.3: The Binning function dialog.

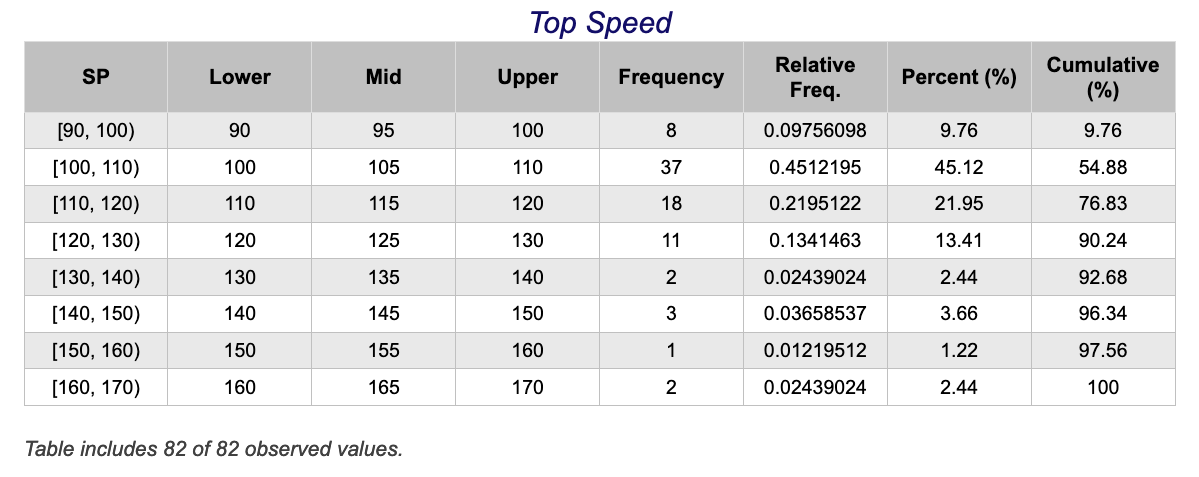
Figure 8.4: An example of a binning output.
Additional Options for Tabulating Numerical Variables:
Click the plus icon
 to tabulate additional variables.
You can give a title to your table under the Table column.
Click the help icon
 to see descriptions of various methods in the Bins section.
You can compute mean, standard deviation, and variance based on the tabulated data.
On the top row of the Rguroo environment, there are three save options. The
Save as ...saves your work as an Rguroo object so you can reproduce it. TheSave Detail Datasetadds a column to the raw dataset indicating to what bin (class) each datum is assigned, and theSave Frequency Dataset.