3 Creating and Editing Tables in Rguroo
- Creating one-way tables
- Creating two-way tables
- Creating contingency tables
- Tables for goodness of fit
- Editing existing tables
3.1 Creating One-Way and Two-Way Tables Using the Rguroo Table Editor
![]()
The Table Editor in Rguroo lets you easily create one-way or two-way frequency tables directly within the application. This subsection describes the steps for creating tables, and the following subsection provides an illustrative example.
Instructions for Creating a New Dataset
Open the Data toolbox located on the left-hand side of the Rguroo application window.
Click on the Data Import dropdown
 and select the Create New Table option. The table editor window, shown in Figure 3.1, will appear.
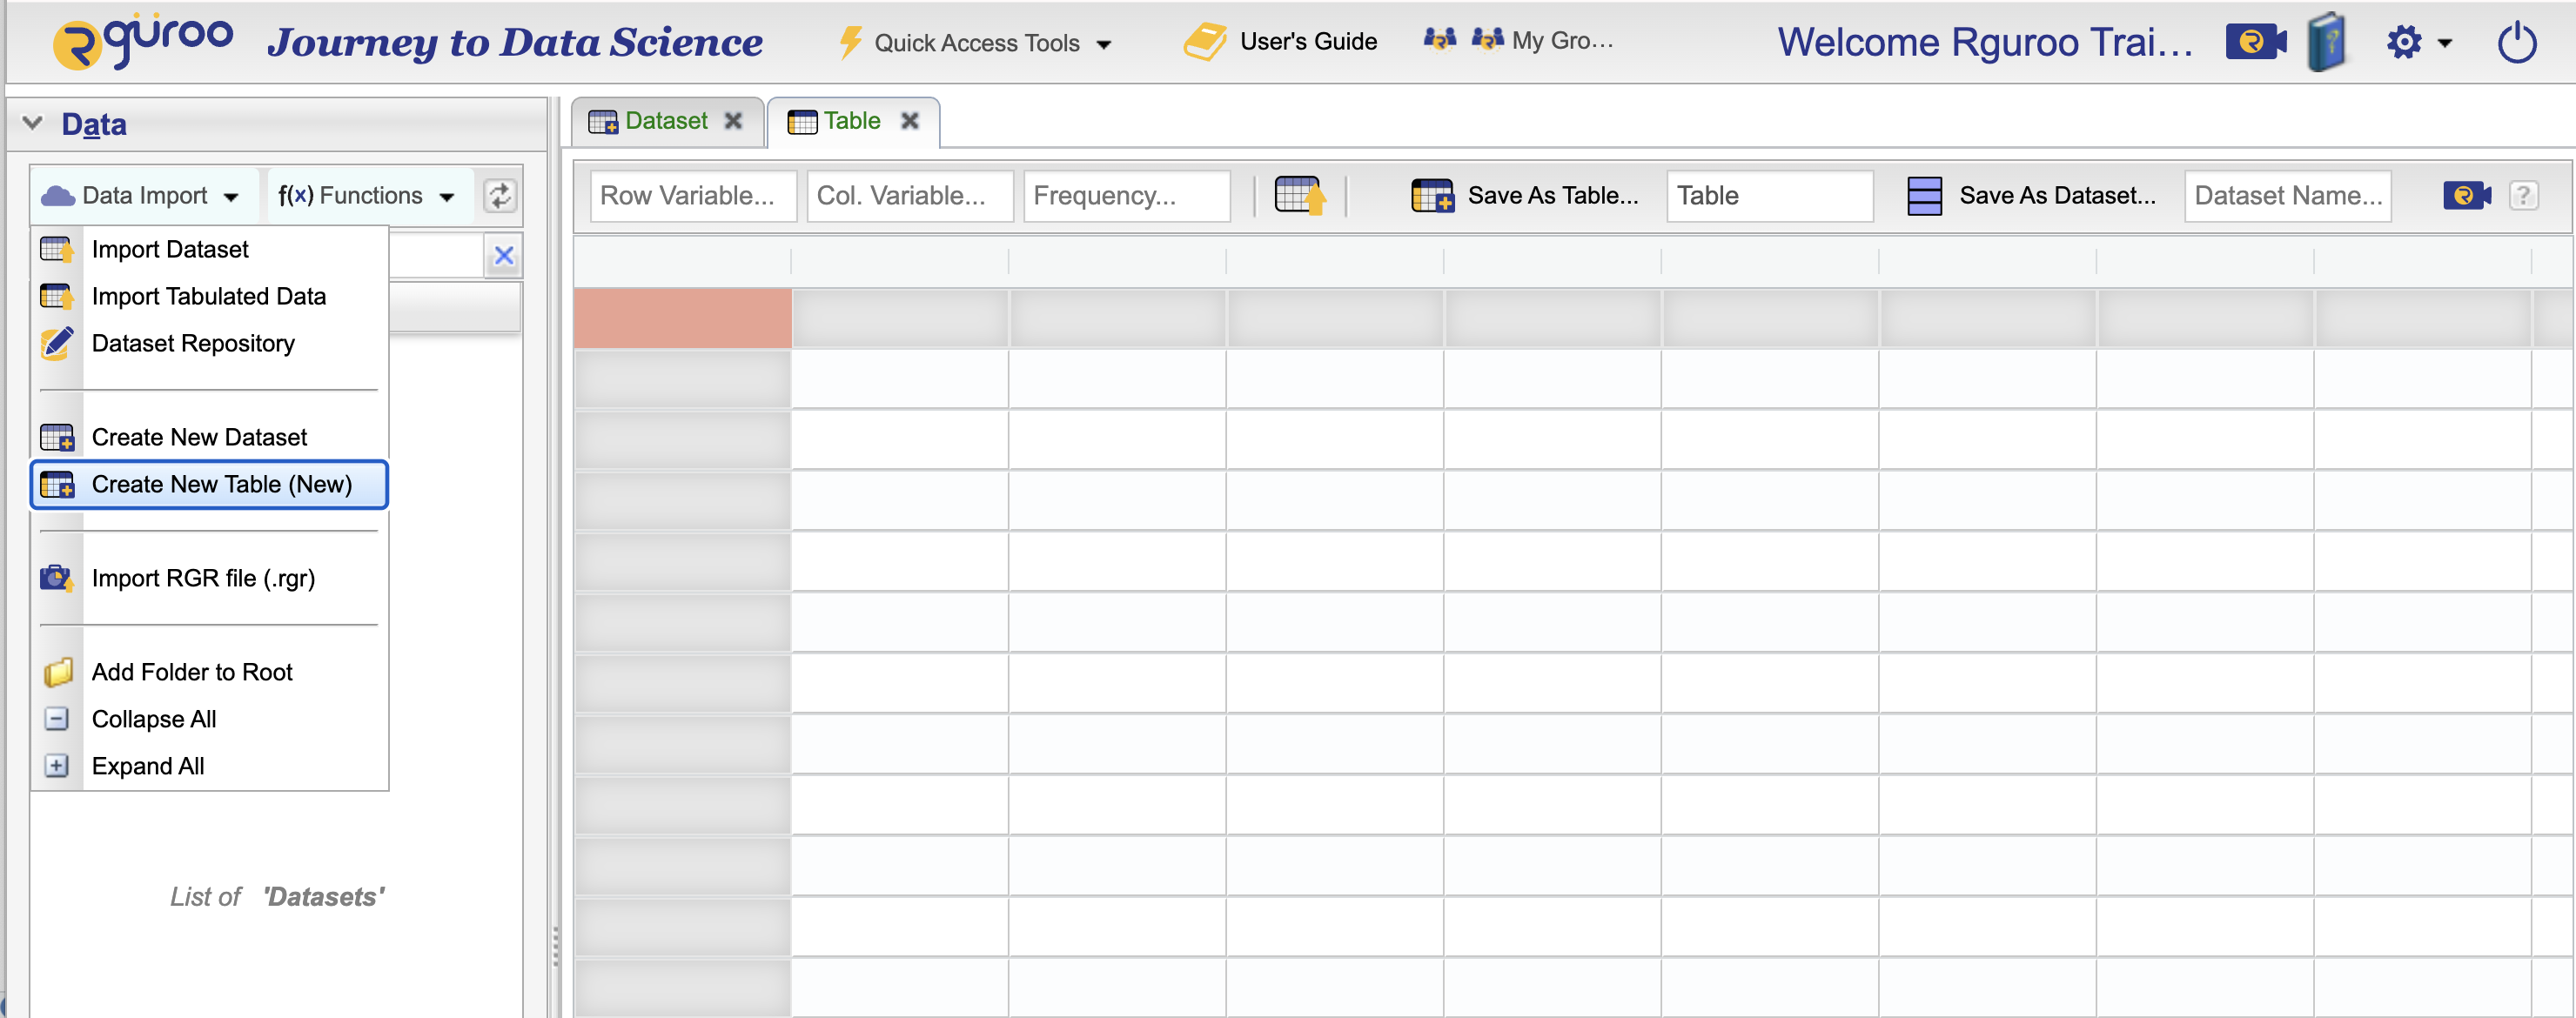
Figure 3.1: Rguroo Table Editor interface
In the three textboxes at the top left of the Table Editor window, enter a row variable name (Row Variable), a column variable name (Col. Variable), and a name for the frequency or a numerical variable (Frequency). See the notes below for more details about these fields.
In the cells with gray backgrounds in the first row of the grid, enter the levels for the column variable.
In the cells with gray backgrounds in the first column, enter the levels for the row variable.
In the white-background cells (i.e., the body of the table), enter values corresponding to the specified row and column levels.
To save your table as a table, enter a name for your table in the Save As Table textbox on the top, and click the
 button.
To save your table as a dataset (with variables in columns) enter a name for your dataset in the Save As Dataset textbox on the top, and click the
 button to save your dataset. To see your dataset as a table click the icon View Dataset
  . Also, see the example in the next subsection for the difference between saving as a table and saving as a dataset.
Notes About Creating Tables
Whether you are creating a one-way or two-way table, you must specify the Frequency variable name. This variable will be used to store the frequency counts for the specified levels of the row and column variables.
While the Table Editor is commonly used to create frequency and contingency tables, Rguroo also allows you to enter non-numeric values in the body of the table.
For one-way tables
- If it’s a row table, you must specify a column variable.
- If it’s a column table, you must specify a row variable.
For two-way tables, you must specify both row and column variable names.
When a table is saved as a dataset, the row, column, and frequency variable names are automatically converted to valid R variable names if they are not already. For example, spaces and other invalid characters will be replaced with dots (.).
When you save your table as a “Table,” the appears under the Data toolbox with a table icon like this
 .
.When you save your table as a “dataset,” the name appears under the Data toolbox with a dataset icon as in
 .
.You can edit your dataset or table at any time by double-clicking its name in the Data toolbox. This will open the dataset editor or the table editor, respectively. Use the table editor to modify tables, and the dataset editor to work with datasets.
3.2 An Example of Specifying a Two-Way Table
In this section, we provide an example demonstrating how to enter data from a two-way table into Rguroo. The example involves survey participants who were asked to select their favorite color and favorite fruit. Participants had three color options (green, red, or yellow) and three fruit options (apple, banana, or orange). There were 70 participants in total. The frequency of each color-fruit combination is displayed in Figure 3.2, and the same data formatted as a dataset is shown in Table 3.1.
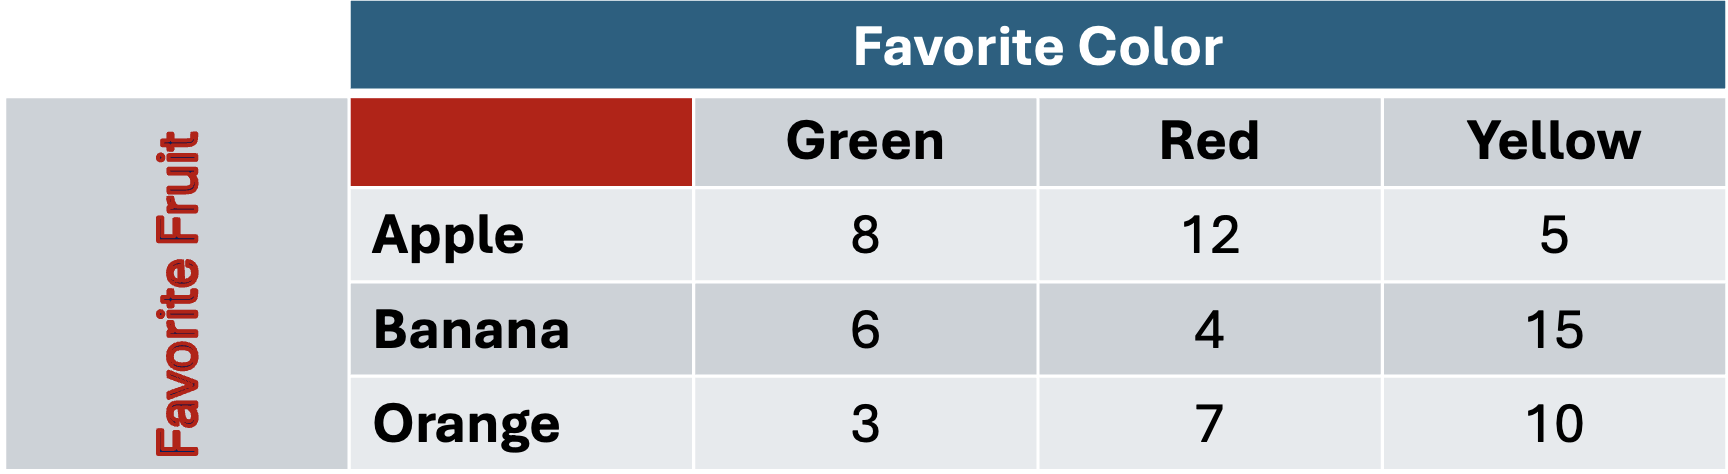
Figure 3.2: An example of a two-way table
| Fruit | Favorite_Color | Count |
|---|---|---|
| Apple | Red | 12 |
| Apple | Green | 8 |
| Apple | Yellow | 5 |
| Banana | Red | 4 |
| Banana | Green | 6 |
| Banana | Yellow | 15 |
| Orange | Red | 7 |
| Orange | Green | 3 |
| Orange | Yellow | 10 |
Figure 3.3 illustrates how the fruit and color data from Figure 3.2 was entered into Rguroo. We labeled the row variable as “Favorite Fruit,” the column variable as “Favorite Color,” and the frequency variable as “Count.” The gray cells contain the levels for the row and column variables, and the numerical values were entered into the table cells. This table was saved in Rguroo under the name “FruitColor.”
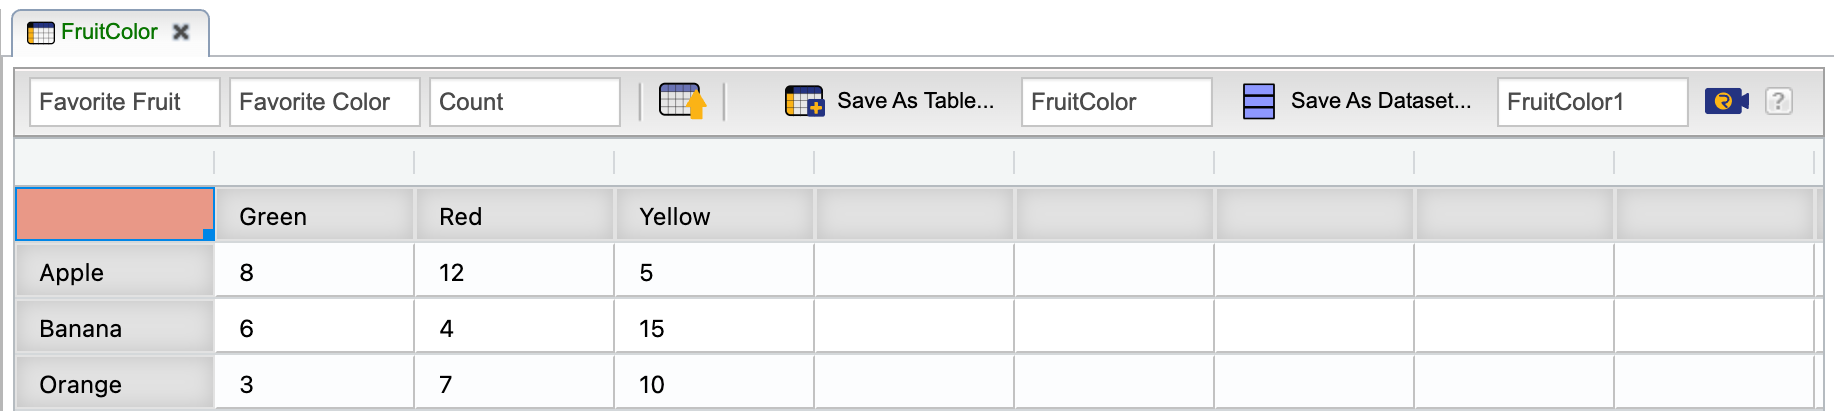
Figure 3.3: Entering the fruit-color data into the Rguroo Table Editor
After saving the table, you can view it side-by-side in both two-way table format and dataset format by clicking the View Dataset icon . An example of this dual view is shown in Figure 3.4.
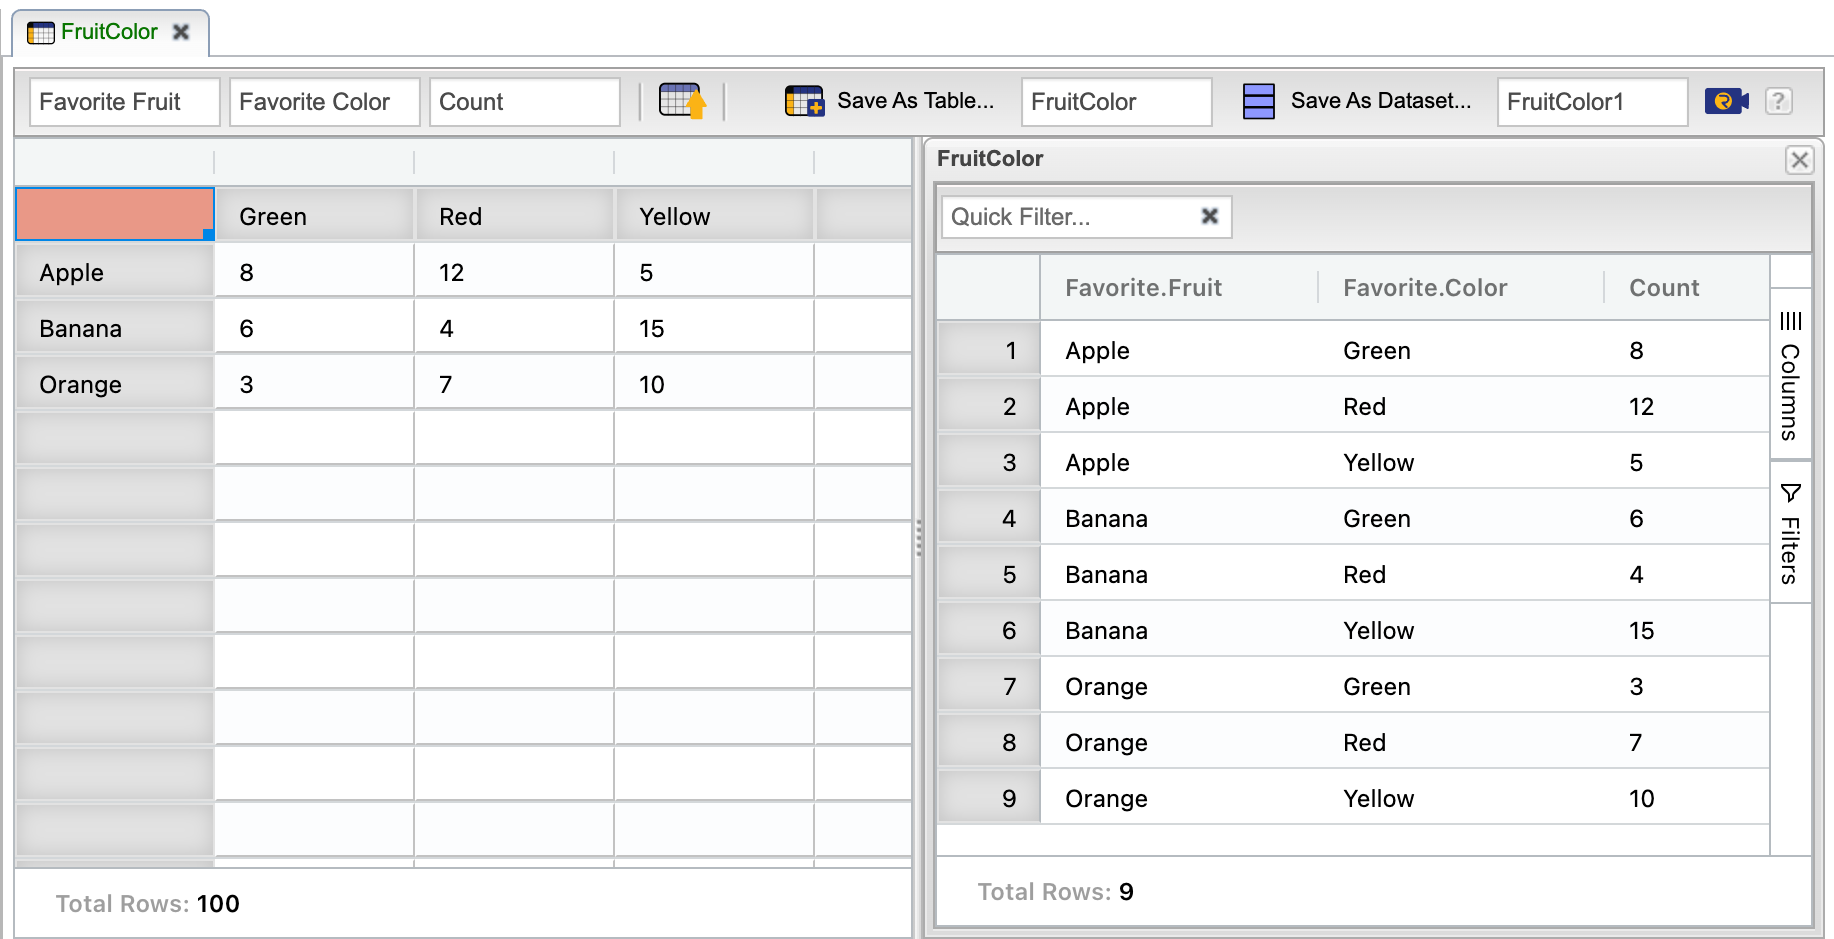
Figure 3.4: The fruit-color data into the Rguroo Table Editor along with its dataset format