25 Probability Calculator
25.1 Probability Calculator - Continuous Random Variables
Rguroo can compute probabilities and inverse probabilities for various discrete and continuous random variables. You can use the option Values –> Probability on the probability calculator to compute probabilities at a set of values that you specify for your selected random variable. To compute inverse probabilities, you can use the option Probability –> Value to obtain values of a random variable for the probability value(s) that you specify.
You can compute probabilities and inverse probabilities for the following continuous random variables: Beta, Cauchy, Chi-Square, Exponential, F, Gamma, Logistic, Log-Normal, Normal, Student t, Triangular, Uniform, and Weibull.
You can compute probabilities and inverse probabilities for the following discrete random variables: Bernoulli, Binomial, Discrete Uniform, Geometric, Hypergeometric, Negative Binomial, and Poisson.
Instructions for computing probabilities for continuous distributions
Open the Probability-Simulation toolbox on the left-hand side of the Rguroo window. Use the
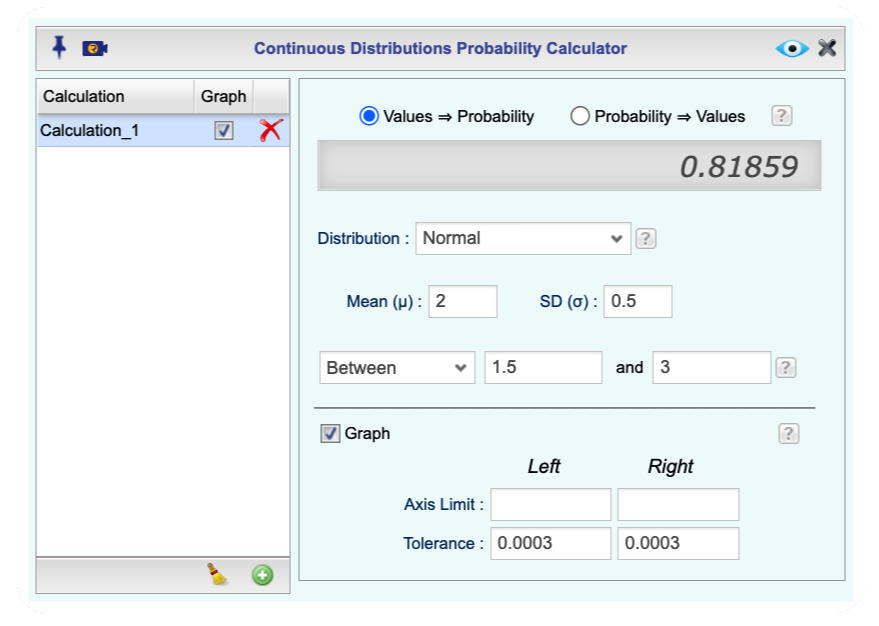
Probabilitydropdown menu and choose Probability Calculator —> Continuous (see Figure 25.1) .By default, the option Values –> Probability is selected. From the Distribution dropdown, select your distribution. In this example, we selected Normal.
Fill in the distribution parameters. For example, for the normal, we fill in the Mean and SD textboxes.
From the next dropdown, select the region for which the probability you want to calculate. Specifically, for a value of \(a\) that you type in the textbox, Below corresponds to \(P(X\leq a)\), and Above corresponds to \(P(X\geq a)\). Also, for given values of \(a\) and \(b\) that you respectively type in the two Lower Tail and Upper Tail textboxes, Between corresponds to \(P(a \leq X\leq b)\), and Outside corresponds to $P(Xa Xb) $.
(Optional) You can select the Graph checkbox to see a graph of the distribution in the output.
(Optional) By clicking the plus icon
 , you can add another probability calculation.
Click the Preview icon
 to view the result.

Figure 25.1: Continuous Probability Calculator Dialog
Instructions for computing inverse probabilities for continuous distributions
Open the Probability-Simulation toolbox on the left-hand side of the Rguroo window. Use the
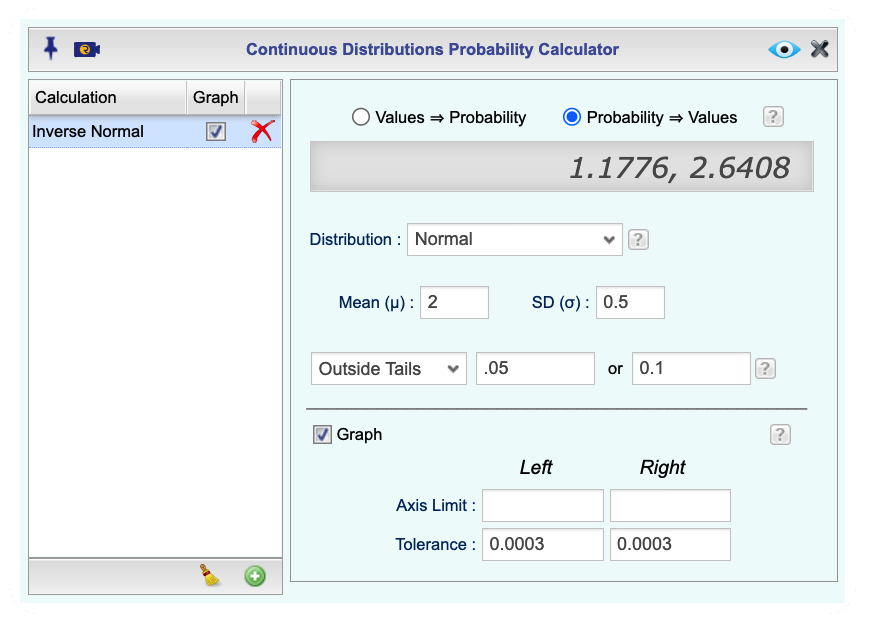
Probabilitydropdown menu and choose Probability Calculator —> Continuous (see Figure 25.2) .Select the option Probability –> Value.
From the Distribution dropdown, select your distribution. In this example, we selected Normal.
Fill in the distribution parameters. For example, for the normal, we fill in the Mean and SD textboxes.
In the next dropdown, type in a probability value(s) (fraction(s) between 0 to 1), and select the region for which the probability applies.
- For a value of \(p\) that you type in the textbox, selecting Below computes an \(a\) value such that \(P(X\leq a) = p\), and selecting Above computes an \(a\) such that \(P(X\geq a) = p\).
- If you select one of the options Between or Outside and type in values of \(p\) and \(q\) in the Lower Tail and Upper Tail textboxes, respectively, then \(a\) and \(b\) are computed such that \(P(X\leq a) = p\) and \(P(X\geq b) = q\).
- For the Between selection, the graph highlights between \(a\) and \(b\), and for the and Outside selection, the graph highlights the tails (outside \(a\) and \(b\)).
(Optional) You can select the Graph checkbox to see a graph of the distribution in the output.
(Optional) By clicking the plus icon
 , you can add another probability calculation.
Click the Preview icon
 to view the result.

Figure 25.2: Continuous Probability Calculator Dialog
25.2 Probability Calculator - Discrete Random Variables
Instructions for computing probabilities for discrete distributions
Open the Probability-Simulation toolbox on the left-hand side of the Rguroo window. Use the
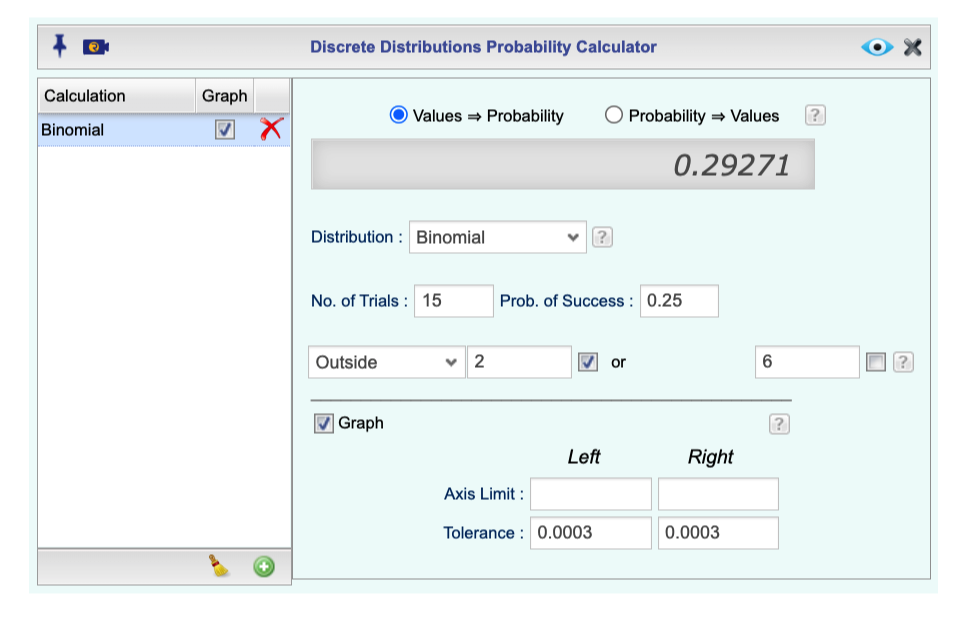
Probabilitydropdown menu and choose Probability Calculator —> Discrete (see Figure 25.3) .By default, the option Values –> Probability is selected. From the Distribution dropdown, select your distribution. In this example, we selected Binomial.
Fill in the distribution parameters. For example, for the binomial, we fill in the No. of Trials and Probability of Success textboxes.
From the next dropdown, select the value(s) for which the probability you want to calculate.
If you select the option Equal from the dropdown, then for a value \(a\) that you type in the probability \(P(X=a)\) is computed.
For all options, except the Equal option, there is a “Include the Value” checkbox that, if checked, the probability at the typed-in value is included.
If the checkbox “Include the Value” on the right side of the textbox is checked, then for a value of \(a\) that you type in the textbox, Below corresponds to \(P(X\leq a)\), and Above corresponds to \(P(X\geq a)\). Also, for given values of \(a\) and \(b\) that you respectively type in the two Lower Tail and Upper Tail textboxes, Between corresponds to \(P(a \leq X\leq b)\), and Outside corresponds to $P(Xa Xb) $.
If the checkbox “Include the Value” on the right side of the textbox is not checked, then probabilities with strict inequality are calculated.
(Optional) You can select the Graph checkbox to see a graph of the distribution in the output.
(Optional) By clicking the plus icon
 , you can add another probability calculation.
Click the Preview icon
 to view the result.

Figure 25.3: Discrete Probability Calculator Dialog
Instructions for computing inverse probabilities for discrete distributions
Open the Probability-Simulation toolbox on the left-hand side of the Rguroo window. Use the
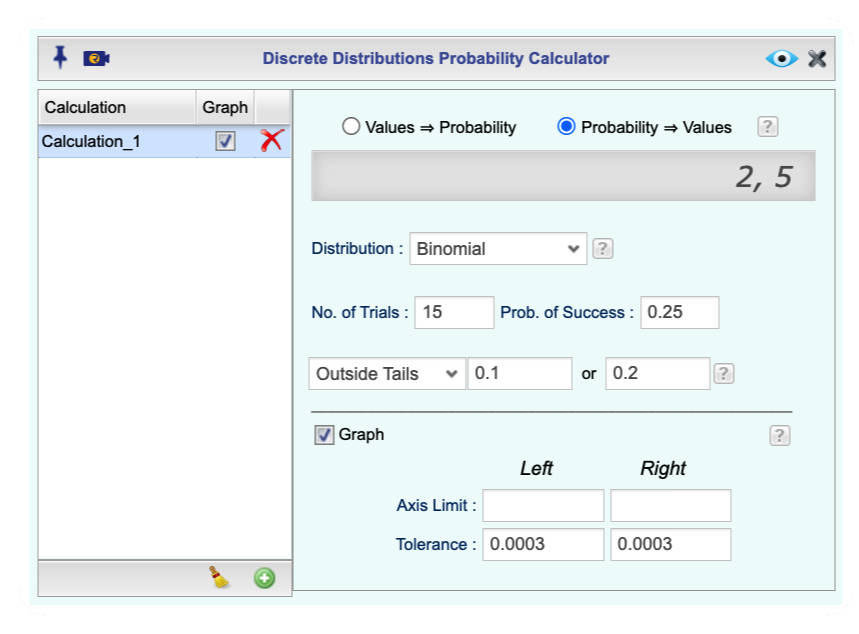
Probabilitydropdown menu and choose Probability Calculator —> Discrete (see Figure 25.4) .Select the option Probability –> Value.
From the Distribution dropdown, select your distribution. In this example, we selected Binomial.
Fill in the distribution parameters. For example, for the binomial, we fill in the No. of Trials and Probability of Success textboxes.
In the next dropdown, type in probability value(s) (fraction(s) between 0 to 1), and select the region for which the probability applies.
- For a value of \(p\) that you type in the textbox, selecting Below computes an \(a\) value such that \(P(X\leq a) \approx p\), and selecting Above computes an \(a\) such that \(P(X\geq a)\approx p\).
- If you select one of the options Between or Outside and type in values of \(p\) and \(q\) in the Lower Tail and Upper Tail textboxes, respectively, then \(a\) and \(b\) are computed such that \(P(X\leq a)\approx p\) and \(P(X\geq b)\approx q\).
- For the Between selection, the graph highlights between \(a\) and \(b\), and for the and Outside selection, the graph highlights the tails (outside \(a\) and \(b\)).
- In most cases approximate values are computed, since exact values are not available due to discreteness. See the output for details.
(Optional) You can select the Graph checkbox to see a graph of the distribution in the output.
(Optional) By clicking the plus icon
 , you can add another probability calculation.
Click the Preview icon
 to view the result.

Figure 25.4: Discrete Probability Calculator Dialog