26 Random Number Generation and Simulation Statistics
You can generate random numbers from various continuous and discrete random variables. You can replicate samples, and apply either a set of predefined statistics or customized statistic (written using R code) to each sample.
Instructions for generating random values from a distribution
Open the Probability-Simulation toolbox on the left-hand side of the Rguroo window. Use the
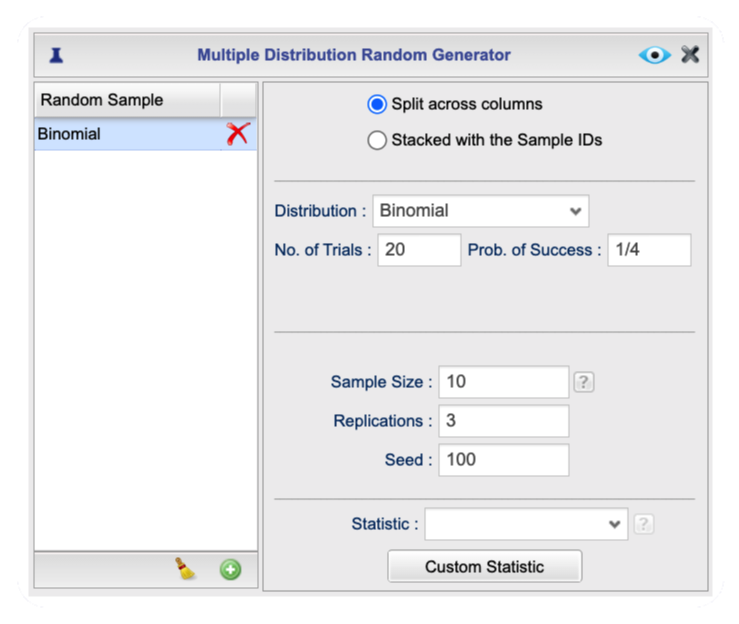
Probabilitydropdown menu and choose Multiple Distribution Generator. The Multiple Distribution Random Generator dialog opens (see Figure 26.1) .Click the plus icon
 to generate a set of random numbers. You can type in a name in the textbox that appears. You can add more than one random variable by clicking on the plus icon
  .
.From the Distribution dropdown, select the distribution from which you want to generate random values. In this example, we selected Binomial.
Fill in the distribution parameters. For example, for the binomial, we fill in the No. of Trials and Probability of Success textboxes.
Specify the Sample Size, number of times you want to replicate your sample (Replication), and a seed for the random generation.
Click the Preview icon
 to view the result.
(Optional) You can save the result as a stand-alone dataset by typing a name in the
Save Dataset Astextbox and clicking on theSave Dataset Asbutton.

Figure 26.1: Multiple Distribution Random Generator Dialog

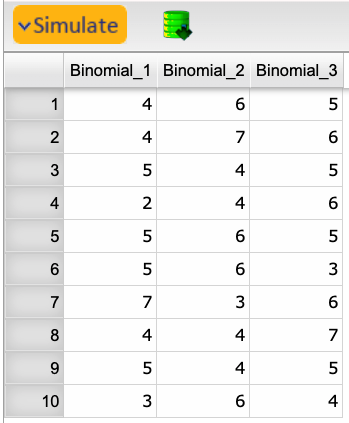
Figure 26.2: Output of Random Generation
26.2 Applying Statistics to Selected Random Samples
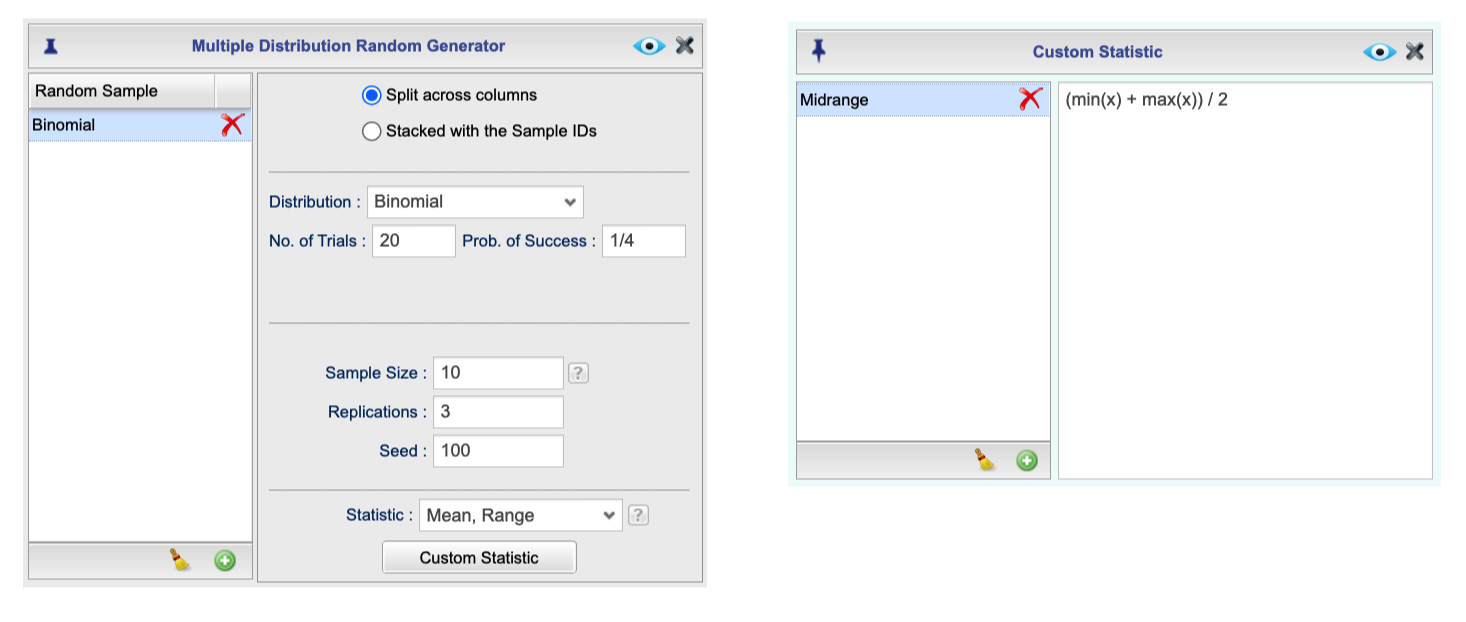
You can apply statistics to the random samples you generate by selecting from a set of predefined standard statistics (e.g., mean, median. standard deviation, etc.) or by writing custom statistics using R code. In the example below, we compute the standard statistic mean and range for the three randomly generated samples of Section 26.1. Moreover, we write an R code to compute the midrange for the three samples.
Instructions for computing statistics oapplied to random samples
Continue the Rguroo instructions of Section 26.1.
From the Statistic dropdown, select Mean and Range (see Figure 26.3) .
To write custom statistics using R code, click on the
Custom Statisticbutton. The Custom Statistic dialog opens.
- Click the plus icon
 to add a statistic. Name your statistic in the textbox that appears.
 - Type your R code on the right-hand side panel. Use lower case x to refer to the generated values (for example, min(x)).
- You can write multiple lines of code. However, the result of your code, when applied to each replicate, must be a single number or character.
Click the Preview icon
 to view the result.
(Optional) You can save the result as a stand-alone dataset by typing a name in the
Save Dataset Astextbox and clicking on theSave Dataset Asbutton.

Figure 26.3: Multiple Distribution Random Generator Dialog
