13 Median Inference (Nonparametric Tests and Confidence Intrevals)
Rguroo Instructions for Confidence Interval for a Single Population Median:
- Use a dataset in your Rguroo account or recreate the example below by importing the cardata dataset from the Rguroo dataset repository called Rguroo Users Guide into your account.
Click here to see a portion of the dataset.

Open the Analytics toolbox on the left-hand side of the Rguroo window. Click on the
Analysisdropdown menu and select Median Inference —> One Population. This opens the One Population Median Inference dialog box (see Figure 13.1).Select a Dataset. In this example, we choose cardata.
Select a Variable from the dropdown menu.
(Optional) Type a label for the populations in the text boxes M = Median of.
Click on the
Confidence Intervaltab:
- Type in your Confidence Level.
- Select one or more methods in the Methods section or in the
 menu. In this example, we selected Binomial, Wilcoxon, Bootstrap Percentile and Bootstrap BCa.
- Click the Preview icon
 to view the result.
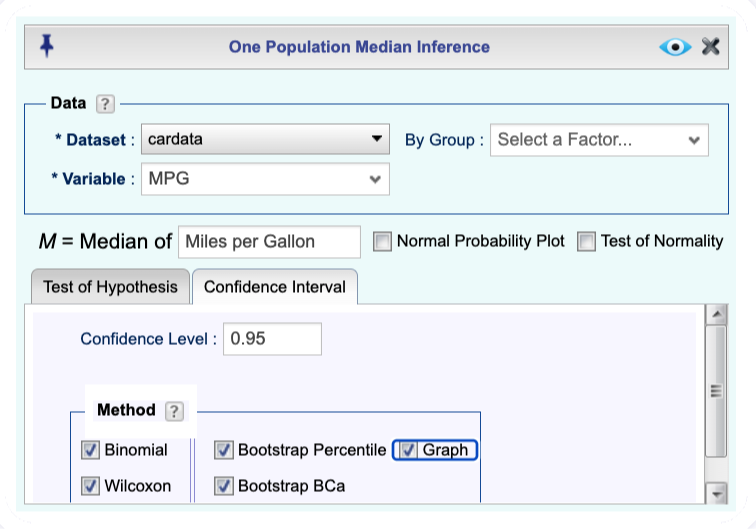
Figure 13.1: The dialog box for the Confidence Interval for a Single Population Median.
Instructions for Confidence Interval for Difference of Two Population Medians (Independent Data):Mann-Whitney U ((Wilcoxon Rank-Sum), Bootstrap Percentile, Bootstrap BCa
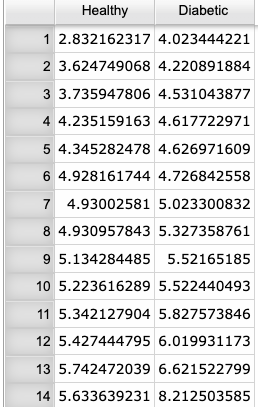
- Use a dataset in your Rguroo account or recreate the example below by importing the glucose dataset from the Rguroo dataset repository called Rguroo Users Guide into your account.
Click here to see the data.
Open the Analytics toolbox on the left-hand side of the Rguroo window. Click on the
Analysisdropdown menu and select Median Inference —> Two Population. This opens the Two Population Median Inference dialog box (see Figure 13.2).Select a Dataset. In this example, we choose glucose.
If values for the two variables to be compared are in two columns, choose Variable 1 and Variable 2 from the dropdown menus. If observed numerical values for both groups are in one column and the two groups to be compared are indicated by a factor variable, use the option Variable and By Factor to select the numerical variable and the variable that represents the groups, respectively.
(Optional) Type a label for the two populations in the text boxes Pop 1 Label and Pop 2 Label.
Click on the
Confidence Intervaltab:
- Type in your Confidence Level.
- Select one or more methods in the Methods section or in the
 menu. In this example, we selected Mann-Whitney and Bootstrap Percentile. Note the method Mann-Whitney U is the same as Wilcoxon Rank Sum.
- Click the Preview icon
 to view the result.
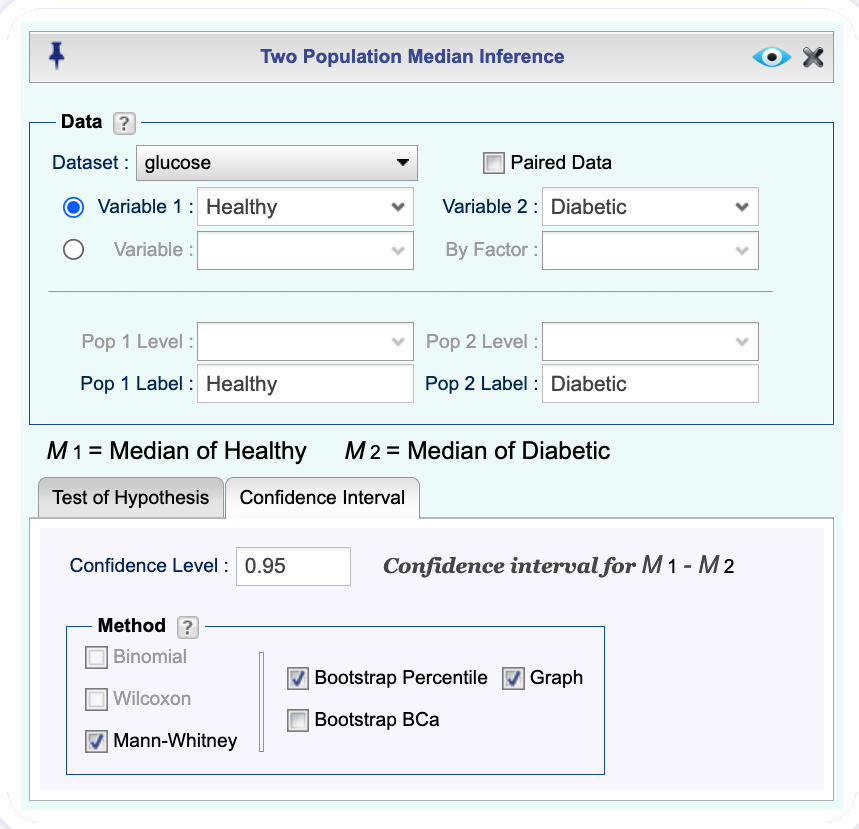
Figure 13.2: The dialog box for the Confidence Interval for Difference of Two Population Medians.
Instructions for Confidence Interval for Difference of Population Medians (Paired Data): Binomial, Wilcoxon, and Bootstrap
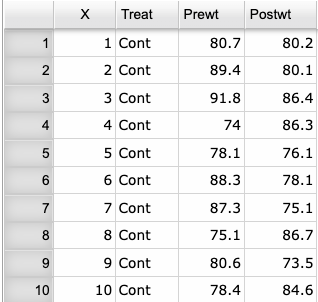
- Use a dataset in your Rguroo account or recreate the example below by importing the anorexia dataset from the Rguroo dataset repository called Rguroo Users Guide into your account.
Click here to see a portion of the data.
Open the Analytics toolbox on the left-hand side of the Rguroo window. Click on the
Analysisdropdown menu and select Median Inference —> Two Population. This opens the Two Population Median Inference dialog box (see Figure 13.3).Select a Dataset. In this example, we choose anorexia.
Select the checkbox Paired Data.
If values for the two variables to be compared are in two columns, choose Variable 1 and Variable 2 from the dropdown menus. If observed numerical values for both groups are in one column and the two groups to be compared are indicated by a factor variable, use the option Variable and By Factor to select the numerical variable and the variable that represents the groups, respectively.
(Optional) Type a label for the two populations in the text boxes Pop 1 Label and Pop 2 Label.
Click on the
Confidence Intervaltab.
- Type in your Confidence Level.
- Select one or more methods in the Methods section or in the
 menu. In this example, we selected Binomial Exact, and Bootstrap Percentile. Optionally you can select Graph to see p-value graphs.
- Click the Preview icon
 to view the result.
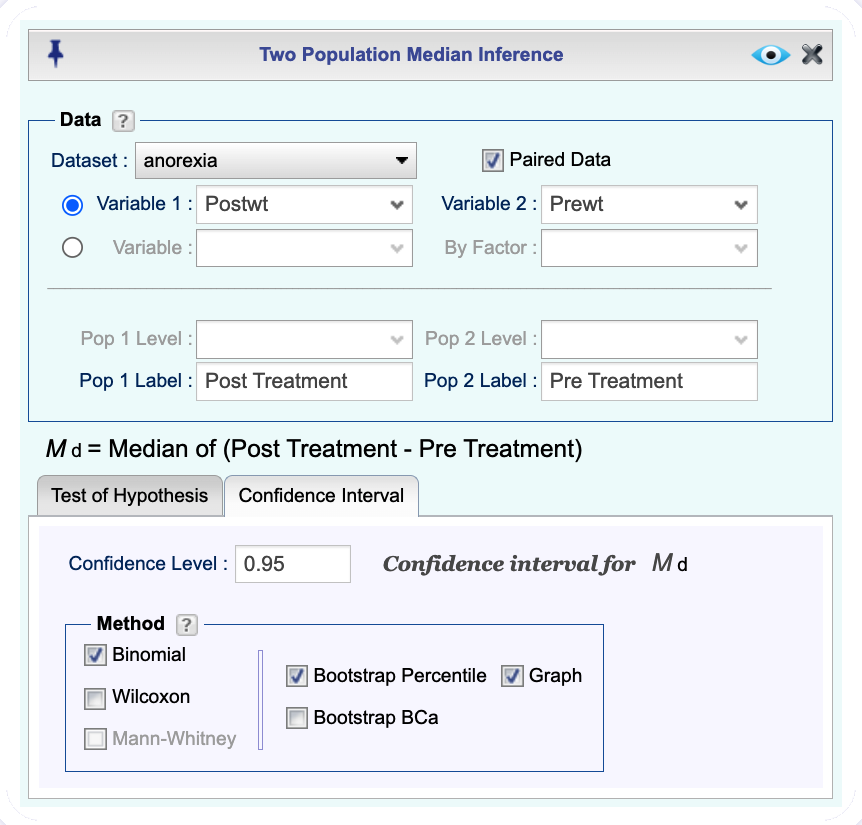
Figure 13.3: The dialog box for the Confidence Interval for Difference of Population Medians (Paired Data).
Instructions for Test of Hypothesis for a Single Population Median: Sign Test and Wilcoxon Signed Rank Test
- Use a dataset in your Rguroo account or recreate the example below by importing the cardata dataset from the Rguroo dataset repository called Rguroo Users Guide into your account.
Click here to see a portion of the dataset.

Open the Analytics toolbox on the left-hand side of the Rguroo window. Click on the
Analysisdropdown menu and select Median Inference —> One Population. This opens the One Population Median Inference dialog box (see Figure 13.4).Select a Dataset. In this example, we choose cardata.
Select a variable from the Variable dropdown.
(Optional) Type a label for the populations in the text boxes M = Median of.
In the
Test of Hypothesistab, select your Significance Level and state the Alternative Hypothesis M.Select one or more methods in the Methods section or in the
 menu. In this example, we selected Sign Test and Wilcoxon Signed-Rank Test.
Click the Preview icon
 to view the result.
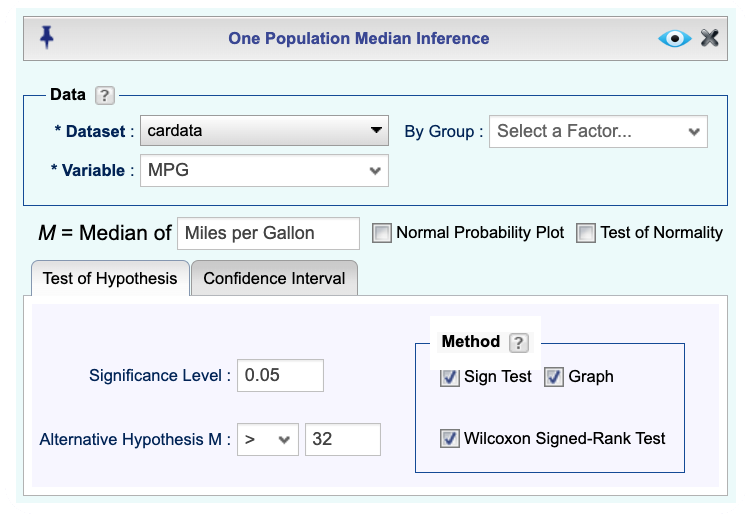
Figure 13.4: The dialog box for the Test of Hypothesis for a Single Population Median.
Instructions for Test of Hypothesis for Difference of Two Population Medians (Independent Data): Mann-Whitney U (Wilcoxon Rank-Sum) Test and Permutation Test
- Use a dataset in your Rguroo account or recreate the example below by importing the glucose dataset from the Rguroo dataset repository called Rguroo Users Guide into your account.
Click here to see the data.

Open the Analytics toolbox on the left-hand side of the Rguroo window. Click on the
Analysisdropdown menu and select Median Inference —> Two Population. This opens the Two Population Median Inference dialog box (see Figure 13.5).Select a Dataset. In this example, we choose glucose.
If values for the two variables to be compared are in two columns, choose Variable 1 and Variable 2 from the dropdown menus. If observed numerical values for both groups are in one column and the two groups to be compared are indicated by a factor variable, use the option Variable and By Factor to select the numerical variable and the variable that represents the groups, respectively.
In the
Test of Hypothesistab, select your Significance Level and state the Alternative Hypothesis M1 - M2.Select one or more methods in the Methods section or in the
 menu. In this example, we selected Mann-Whitney and Permutation. Note the method Mann-Whitney U test is also called Wilcoxon Rank Sum Test.
Click the Preview icon
 to view the result.
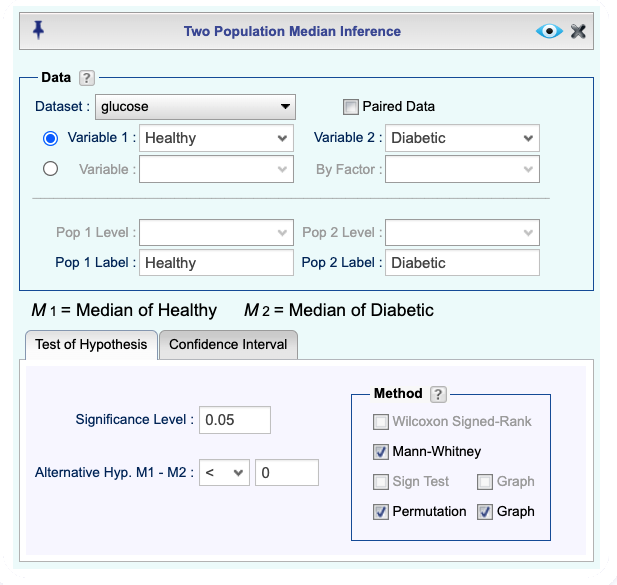
Figure 13.5: The dialog box for the Test of Hypothesis for Difference of Two Population Medians (Independent Data).
Instructions for Test of Hypothesis for Difference of Population Medians (Paired Data): Wilcoxon Signed-Rank Test, Sign Test, and Permutation Test
- Use a dataset in your Rguroo account or recreate the example below by importing the anorexia dataset from the Rguroo dataset repository called Rguroo Users Guide into your account.
Click here to see a portion of the data.

Open the Analytics toolbox on the left-hand side of the Rguroo window. Click on the
Analysisdropdown menu and select Median Inference —> Two Population. This opens the Two Population Median Inference dialog box (see Figure 13.6).Select a Dataset. In this example, we choose anorexia.
Select the checkbox Paired Data.
If values for the two variables to be compared are in two columns, choose Variable 1 and Variable 2 from the dropdown menus. If observed numerical values for both groups are in one column and the two groups to be compared are indicated by a factor variable, use the option Variable and By Factor to select the numerical variable and the variable that represents the groups, respectively.
(Optional) Type a label for the two populations in the textboxes Pop 1 Label and Pop 2 Label.
In the
Test of Hypothesistab, typ in your Significance Level and state the Alternative Hypothesis M1 - M2.Select one or more methods in the Methods section or in the
 menu. In this example, we selected Wilcoxon Signed-Rank Test, Sign Test, and Permutation Test. Optionally you can select Graph to see p-value graphs.
Click the Preview icon
 to view the result.
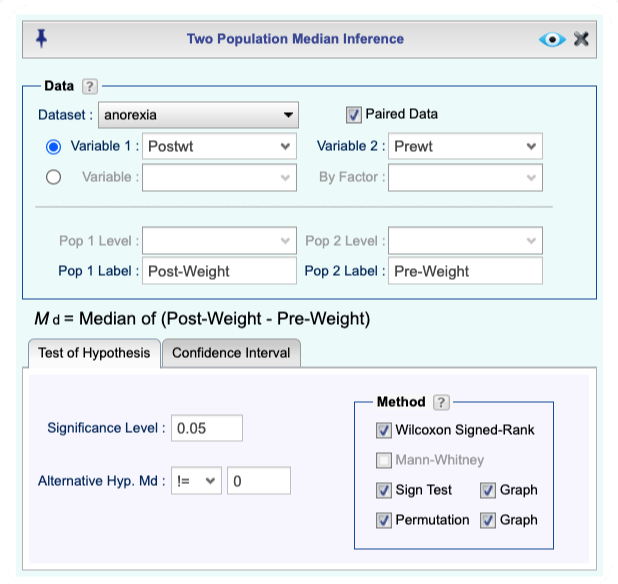
Figure 13.6: The dialog box for the Test of Hypothesis for Difference of Population Medians (Paired Data).