Data Summary
| Cases read | Cases missing | Cases used | Min | Median | Max |
|---|---|---|---|---|---|
| 82 | 0 | 82 | 13.2 | 32.45 | 65.4 |
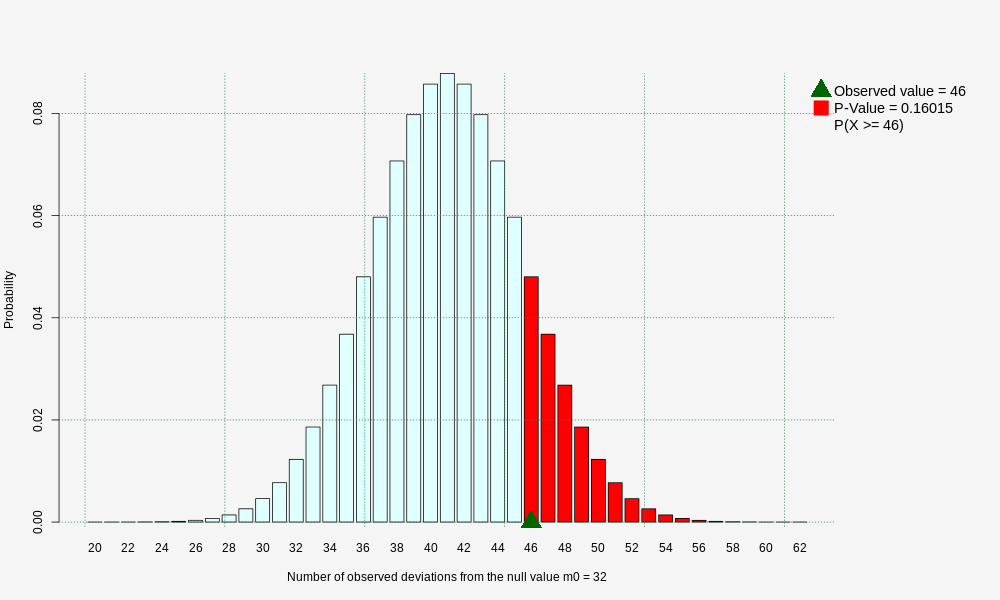
Test of Hypothesis about Median of Differences: Miles per Gallon
Method: Sign Test
Null Hypothesis H0: Median of difference 'Miles per Gallon' is equal to 32
Alternative Hypothesis Ha: Median of difference 'Miles per Gallon' is greater than 32
| Sample Size | Sample Median | Number Below | Number Equal | Number Above | P-Value |
|---|---|---|---|---|---|
| 82 | 32.45 | 36 | 0 | 46 | 0.160147 |
Test is not significant at 5% level.
P-Value Graph: Miles per Gallon
Sign Test Using the Binomial Distribution
Null Density: Binomial; n = 82, p = 0.5
Alternative Hypothesis Ha: Median of 'Miles per Gallon' is greater than 32
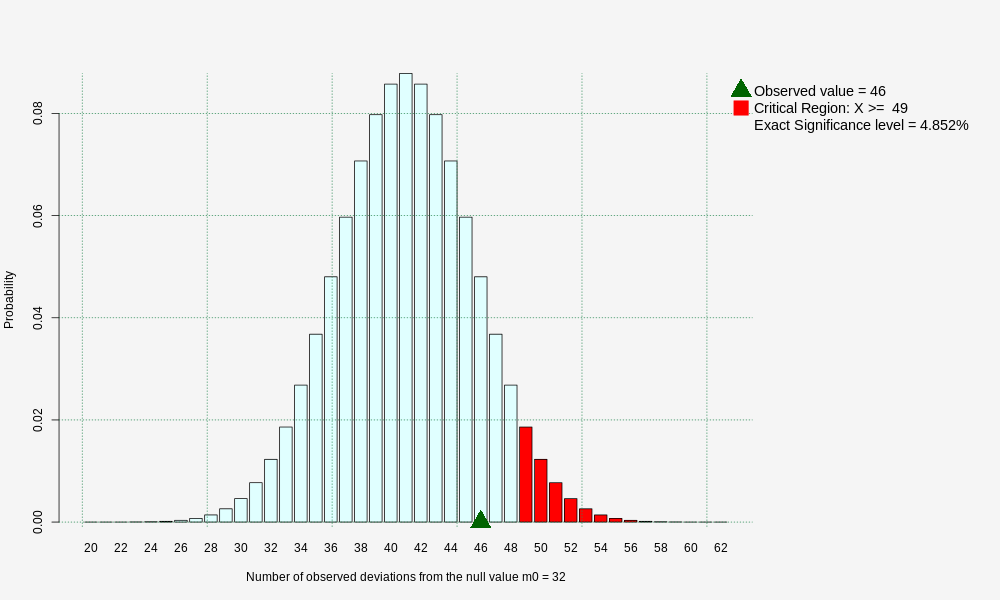
Critical Region Graph: Miles per Gallon
Sign Test Using the Binomial Distribution
Null Density: Binomial; n = 82, p = 0.5
Alternative Hypothesis Ha: Median of 'Miles per Gallon' is greater than 32
Wilcoxon Signed-Rank Test of Location: Miles per Gallon
Null Hypothesis H0: Location of 'Miles per Gallon' is equal to 32
Alternative Hypothesis Ha: Location of 'Miles per Gallon' is greater than 32
| Method | Wilcoxon Stat. | P-Value |
|---|---|---|
| Normal Approximation with CC | 1953.5 | 0.12245 |