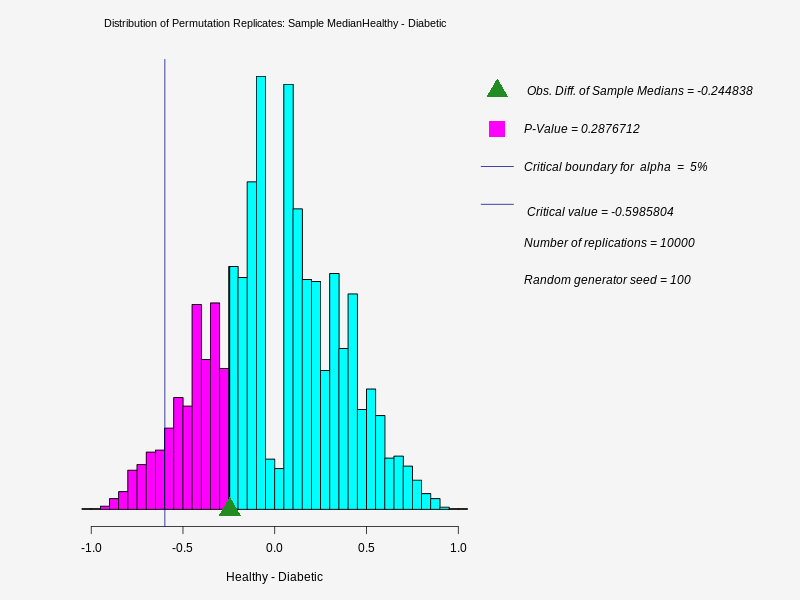
Two Population Median InferenceData Summary
| Variable | Cases read | Cases missing | Cases used | Min | Median | Max |
| Healthy | 14 | 0 | 14 | 2.83216 | 4.93049 | 5.74247 |
| Diabetic | 14 | 0 | 14 | 4.62004 | 5.17533 | 8.2125 |
Mann-Whitney Test of Shift in Location: Healthy - Diabetic
Sample sizes: Healthy = 14; Diabetic = 14
Difference of Sample Medians Healthy - Diabetic = -0.244838
Null Hypothesis H0: Shift in Location 'Healthy - Diabetic' is equal to 0
Alternative Hypothesis Ha: Shift in Location 'Healthy - Diabetic' is less than 0
| Method | Test Stat. | P-Value |
| Exact | 72 | 0.122815 |
Permutation Test of Difference of Medians: Healthy - Diabetic
Alternative Hypothesis Ha: Difference of Medians of Healthy and Diabetic is less than 0
Number of replications = 10000; Random generator seed = 100
| Diff Obs Sample Medians | Median Permutation Diff | 5% Lower Critical Value | P-value |
| -0.244838 | -0.00189991 | -0.59858 | 0.287671 |
Test is not significant at 5% level.
Distribution of Permutation Replicates: Sample Median
Healthy - Diabetic
