Two Population Median InferenceData Summary
| Variable | Cases read | Cases missing | Cases used | Min | Median | Max |
| Healthy | 14 | 0 | 14 | 2.83216 | 4.93049 | 5.74247 |
| Diabetic | 14 | 0 | 14 | 4.62004 | 5.17533 | 8.2125 |
Mann-Whitney Confidence Interval for Population Location: Healthy - Diabetic
Confidence Level = 95%
| Method | Lower CL | Upper CL |
| Exact | -1.19128 | 0.303986 |
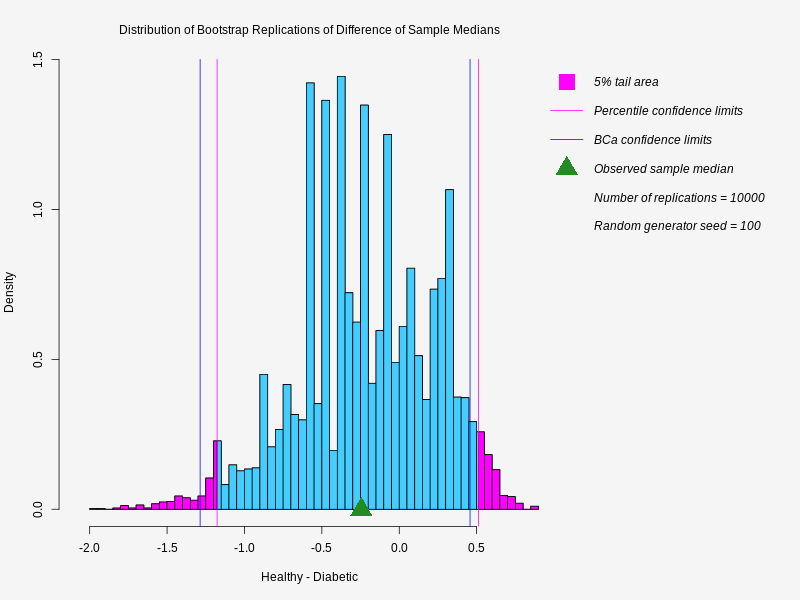
Bootstrap Confidence Interval for Difference of Population Medians:
Healthy - Diabetic
Confidence Level = 95%
Number of replications = 10000; Random generator seed = 100
Sample sizes: Healthy = 14; Diabetic = 14
Difference of Sample Medians = -0.244838; Bootstrap SE = 0.4387024
| Method | Lower CL | Upper CL |
| Percentile | -1.176764 | 0.5119937 |
Distribution of Bootstrap Replications of Difference of Sample Medians
Healthy - Diabetic
