Case Summary
Model: weight ~ group + plot
| Data.Used | No. |
|---|---|
| Number of cases read | 30 |
| Number of cases used in analysis | 30 |
| Number of incomplete cases (omitted) | 0 |
Response Variable Summary
Model: weight ~ group + plot
| Count | NAs (Missings) |
|---|---|
| 30 | 0 |
Effect: group
| group | Count | NAs (Missings) |
|---|---|---|
| ctrl | 10 | 0 |
| trt1 | 10 | 0 |
| trt2 | 10 | 0 |
Effect: plot
| plot | Count | NAs (Missings) |
|---|---|---|
| A | 15 | 0 |
| B | 15 | 0 |
Boxplot:
weight ~ group + plot
Friedman (Non-Parametric) Analysis of Variance Table
There are 5 observations of weight for each combination of levels of group and plot.
The mean value for each combination level is used since Friedman Test requires one observation for each combination.
Model: weight ~ group + plot
| Method | Observed Chi-Squared | df | p-value | BFB |
|---|---|---|---|---|
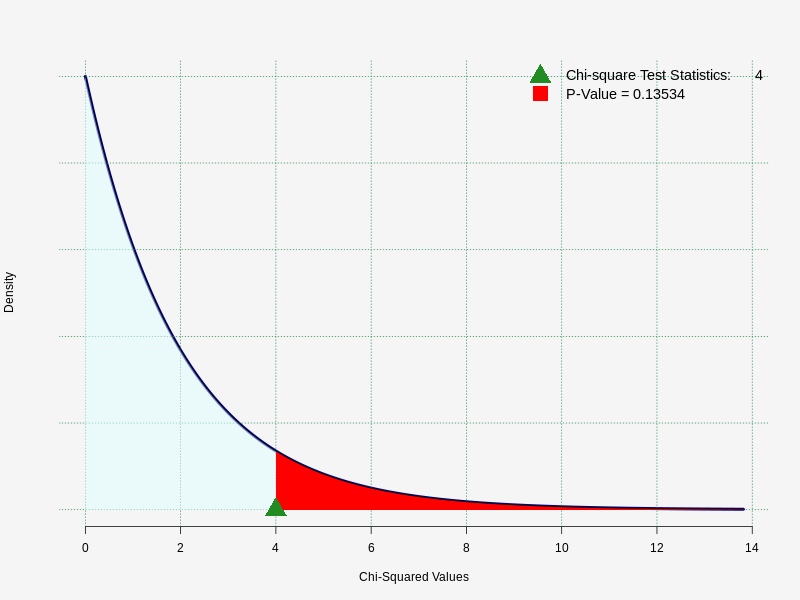
| Friedman rank sum test | 4 | 2 | 0.135335 | 1.35914 |
Response is not significant different at 5% significance level.
Friedman (Non-Parametric) ANOVA P-value Graph
H0: The response for all treatment levels (groups) are the same across the subjects/blocks

Response is not significant at 5% significance level.
Two-way Permutation Test
There are 5 observations of weight for each combination of levels of group and plot.
The mean value for each combination level is used since Permutation Test requires one observation for each combination.
Model: weight ~ group + plot
| Method | Observed Chi-Squared | p-value | BFB |
|---|---|---|---|
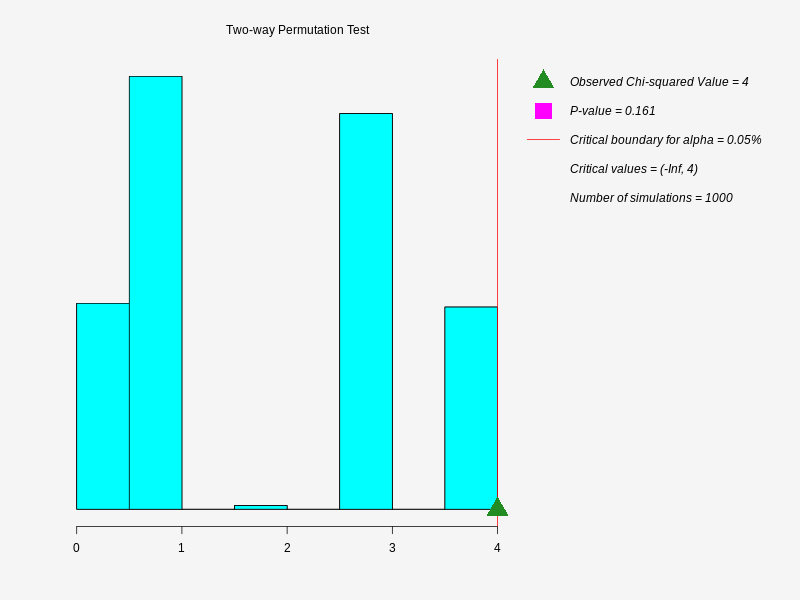
| Permutation Friedman Chi-square | 4 | 0.161 | 1.25111 |
Response is not significant different at 5% significance level.
Two-way Permutation Test P-value Graph
