Case Summary
Model: weight ~ group
| Data.Used | No. |
|---|---|
| Number of cases read | 30 |
| Number of cases used in analysis | 30 |
| Number of incomplete cases (omitted) | 0 |
Response Variable Summary
Model: weight ~ group
| Count | NAs (Missings) |
|---|---|
| 30 | 0 |
Effect: group
| group | Count | NAs (Missings) |
|---|---|---|
| ctrl | 10 | 0 |
| trt1 | 10 | 0 |
| trt2 | 10 | 0 |
Kruskal-Wallis Test
Model: weight ~ group
| Method | Observed Chi-Squared | df | p-value | BFB |
|---|---|---|---|---|
| Kruskal-Wallis rank sum test | 7.98823 | 2 | 0.0184238 | 4.99927 |
Response is significant at 5% significance level.
Boxplot:
weight ~ group

Kruskal-Wallis P-value Graph
Model: weight ~ group
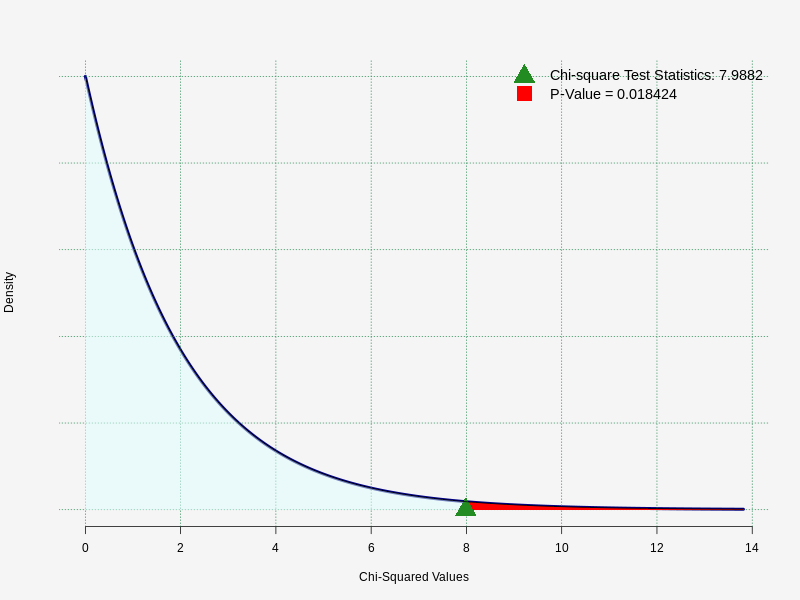
Response is significant at 5% significance level.
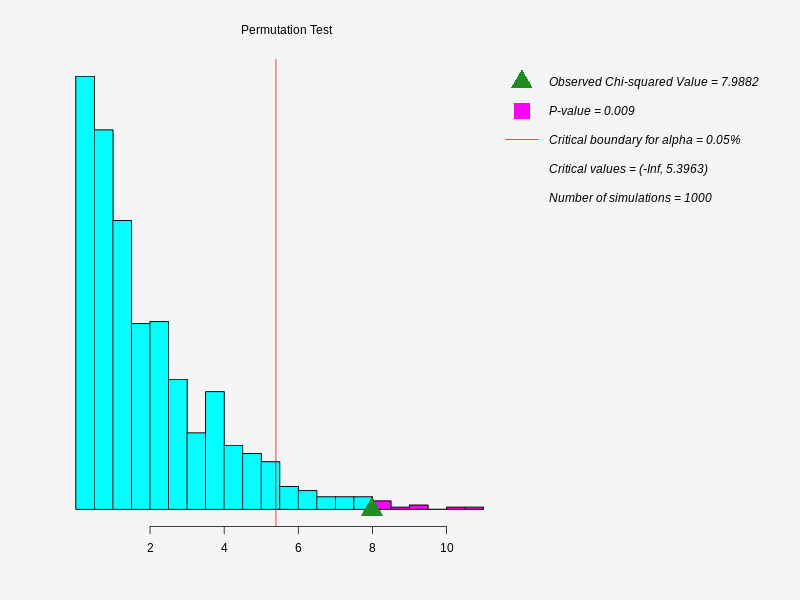
Permutation Test
Model: weight ~ group
| Method | Observed Chi-Squared | p-value | BFB |
|---|---|---|---|
| Permutation K-W Chi-square | 7.98823 | 0.009 | 8.67747 |
Response is significant at 5% significance level.
Permutation Test P-value Graph
Model: weight ~ group