Data Summary
| Variable | Sample Size | Mean | Sample Std Dev |
|---|---|---|---|
| Initial.Weight | 68 | 136.074 | 24.3711 |
| Terminal.Weight | 68 | 137.985 | 24.6101 |
| [Initial.Weight - Terminal.Weight] | 68 | -1.91176 | 2.12824 |
Statistics for the difference [Initial.Weight - Terminal.Weight] is based on differences of observed pairs of data.
Test of Hypothesis: Paired t-Test
[Initial.Weight - Terminal.Weight]
Alternative Hypothesis Ha: Mean of paired differences '[Initial.Weight - Terminal.Weight]' is less than 0
5% lower critical value in units of data = -0.4304678
Differences of pairs were used.
| Mean of Paired Diff | Std Error | Obs t Stat | DF | 5% t-Lower Critical | P-value |
|---|---|---|---|---|---|
| -1.91176 | 0.258087 | -7.40744 | 67 | -1.66792 | 1.40637e-10 |
Test is significant at 5% level.
P-value Graph: Paired t-Test
Null density (in units of data): Student t; mean = 0, scale = 0.25809, df = 67
Alternative Hypothesis Ha: Mean of differences '[Initial.Weight - Terminal.Weight]' is less than 0

Test of Hypothesis: Paired z-Test
[Initial.Weight - Terminal.Weight]
Alternative Hypothesis Ha: Mean of paired differences '[Initial.Weight - Terminal.Weight]' is less than 0
5% lower critical value in units of data = -0.4245156
Differences of pairs were used.
| Mean of Paired Diff | Std Error | Obs z Stat | 5% z-Lower Critical | P-Value |
|---|---|---|---|---|
| -1.91176 | 0.258087 | -7.40744 | -1.64485 | 6.43816e-14 |
Test is significant at 5% level.
P-value Graph: Paired z-Test
Null density (in units of data): Normal; mean = 0 , sd = 0.25809
Alternative Hypothesis Ha: Mean of differences '[Initial.Weight - Terminal.Weight]' is less than 0

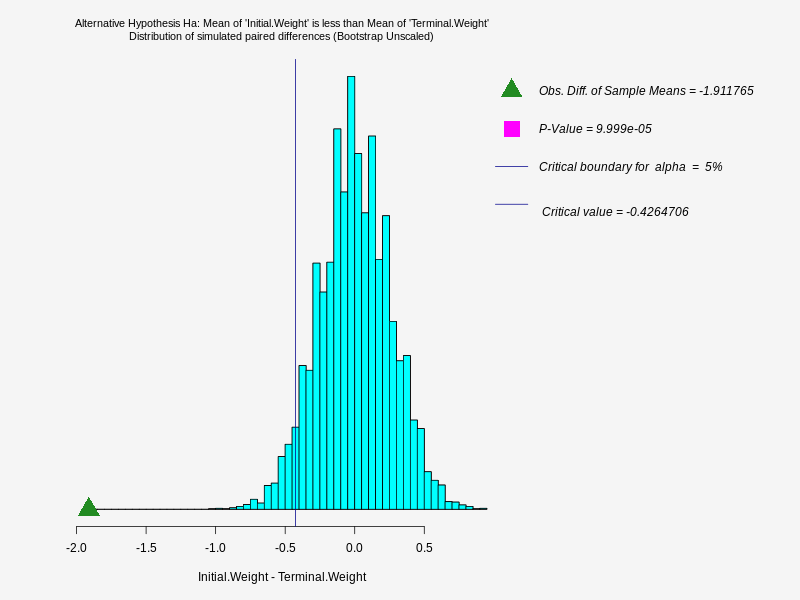
Test of Hypothesis: Bootstrap (Unscaled Mean of Paired Differences)
Initial.Weight - Terminal.Weight
Alternative Hypothesis Ha: Mean of differences 'Initial.Weight - Terminal.Weight' is less than 0
Number of replications = 10000; Random generator seed = 100
| Mean Obs Paired Diffs | Mean Bootstrap Paired Diff | SD Bootstrap Paired Diff | 5% Lower Critical Value | P-Value |
|---|---|---|---|---|
| -1.91176 | 0.00226595 | 0.258497 | -0.426471 | 9.999e-05 |
Test is significant at 5% level.
Distribution of Bootstrap Replicates: Mean of Paired Differences
Initial.Weight - Terminal.Weight
Number of replications = 10000, Random generator seed = 100
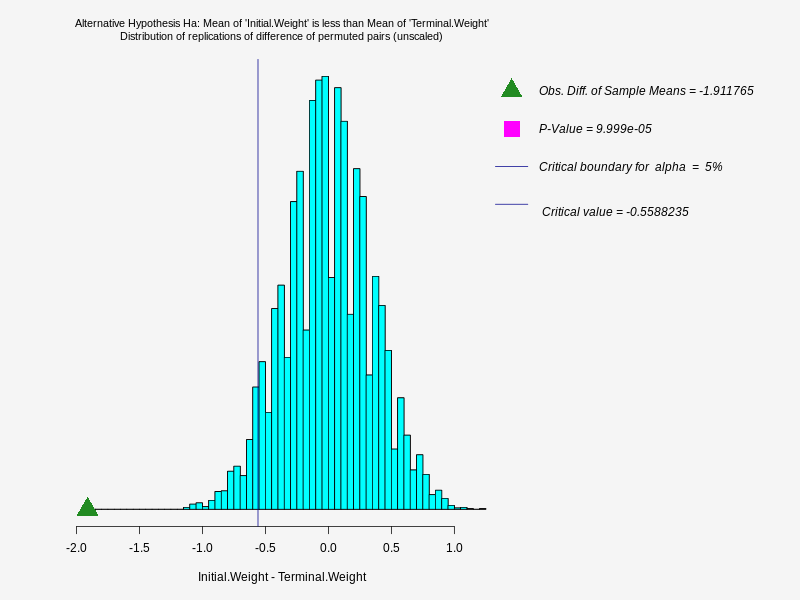
Test of Hypothesis: Permutation (Unscaled Mean of Paired Differences)
Initial.Weight - Terminal.Weight
Alternative Hypothesis Ha: Mean of differences 'Initial.Weight - Terminal.Weight' is less than 0
Number of replications = 10000; Random generator seed = 100
| Mean Obs Paired Diffs | Mean Permutation Paired Diff | SD Permutation Paired Diff | 5% Lower Critical Value | P-Value |
|---|---|---|---|---|
| -1.91176 | -0.00254975 | 0.344153 | -0.558824 | 9.999e-05 |
Test is significant at 5% level.
Distribution of Permutation Replicates: Mean of Paired Differences
Initial.Weight - Terminal.Weight
Number of replications = 10000, Random generator seed = 100