Population Mean InferenceData Summary
| Variable | Sample Size | Mean | Sample Std Dev |
| MPG (Subcompact) | 22 | 41.3318 | 8.46097 |
| MPG (Compact) | 16 | 36.1313 | 8.62428 |
Test of Hypothesis: t-Test
MPG (Subcompact) - MPG (Compact)
Alternative Hypothesis Ha: Difference of means 'MPG (Subcompact) - MPG (Compact)' is greater than 0
5% upper critical value in units of data = 4.73138
Equal population variances was assumed.
| Difference of Means | Std Error | Obs t Stat | DF | 5% t-Upper Critical | P-value |
| 5.20057 | 2.80246 | 1.85572 | 36 | 1.6883 | 0.0358476 |
Test is significant at 5% level.
P-value Graph: t-Test
Null density (in units of data): Student t; mean = 0, scale = 2.8025, df = 36
Alternative Hypothesis Ha: Difference of means 'MPG (Subcompact) - MPG (Compact)' is greater than 0
Assumed equal population variances; pooled variance was used.
Test of Hypothesis: z-Test
MPG (Subcompact) - MPG (Compact)
Alternative Hypothesis Ha: Difference of means 'MPG (Subcompact) - MPG (Compact)' is greater than 0
5% upper critical value in units of data = 4.623953
| Difference of Means | Std Error | Obs z Stat | 5% z-Upper Critical | P-Value |
| 5.20057 | 2.81116 | 1.84997 | 1.64485 | 0.032159 |
Test is significant at 5% level.
P-value Graph: z-Test
Null density (in units of data): Normal; mean = 0 , sd = 2.8112
Alternative Hypothesis Ha: Difference of means 'MPG (Subcompact) - MPG (Compact)' is greater than 0
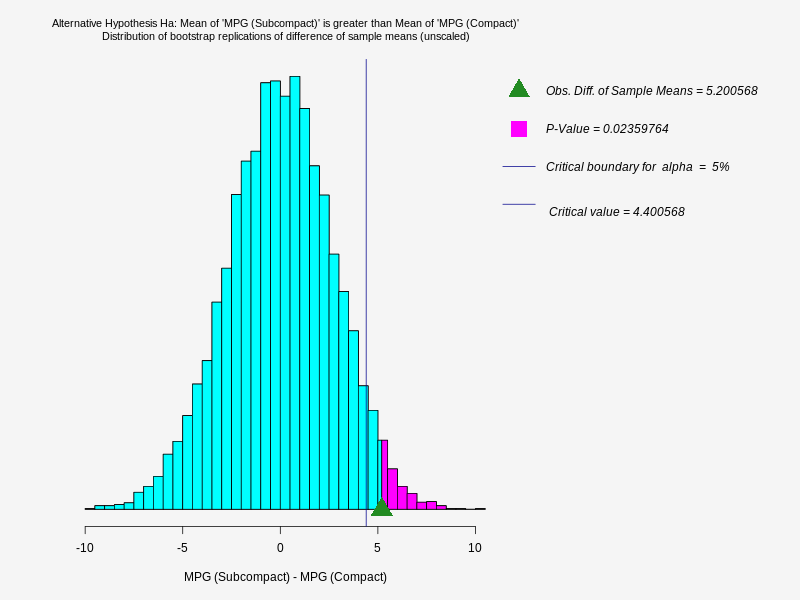
Test of Hypothesis: Bootstrap Unscaled Difference of Means
MPG (Subcompact) - MPG (Compact)
Alternative Hypothesis Ha: Difference of means 'MPG (Subcompact) - MPG (Compact)' is greater than 0
Number of replications = 10000; Random generator seed = 100
| Diff Obs Sample Means | Mean Bootstrap Diff | SD Bootstrap Diff | 5% Upper Critical Value | P-Value |
| 5.20057 | -0.00948922 | 2.70779 | 4.40057 | 0.0235976 |
Test is significant at 5% level.
Distribution of Bootstrap Replicates: Sample Mean
MPG (Subcompact) - MPG (Compact)
Number of replications = 10000, Random generator seed = 100
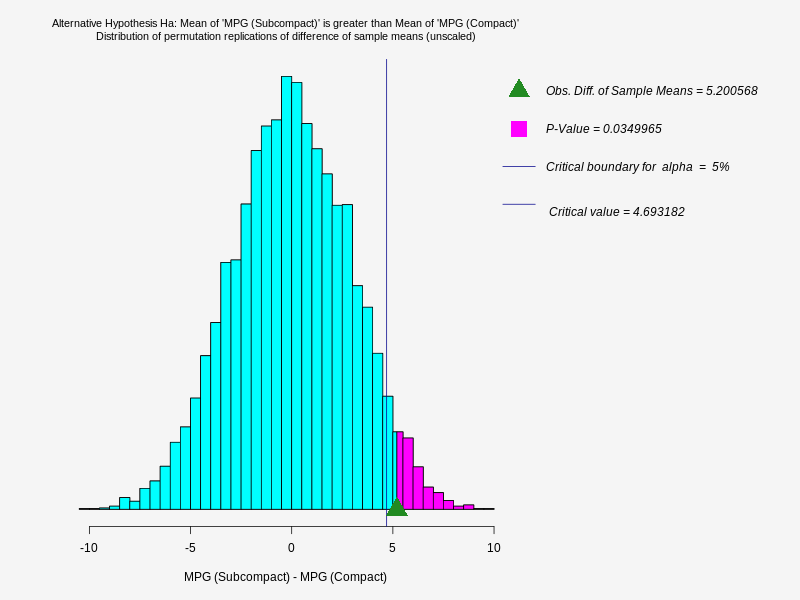
Test of Hypothesis: Permutation Unscaled Difference of Means
MPG (Subcompact) - MPG (Compact)
Alternative Hypothesis Ha: Difference of means 'MPG (Subcompact) - MPG (Compact)' is greater than 0
Number of replications = 10000; Random generator seed = 100
| Diff Obs Sample Means | Mean Permutation Diff | SD Permutation Diff | 5% Upper Critical Value | P-Value |
| 5.20057 | -0.00930998 | 2.89499 | 4.69318 | 0.0349965 |
Test is significant at 5% level.
Distribution of Permutation Replicates: Sample Mean
MPG (Subcompact) - MPG (Compact)
Number of replications = 10000, Random generator seed = 100

