One Population Mean InferenceData Summary
| Variable | Sample Size | Mean | Sample Std Dev |
| Miles Per Gallon | 82 | 33.7817 | 10.0046 |
Test of Hypothesis: t-Test
Miles Per Gallon
Alternative Hypothesis Ha: Mean of 'Miles Per Gallon' is greater than 32
5% upper critical value in units of data = 33.8383
| Sample Mean | Std Error | Obs t Stat | DF | 5% t-Upper Critical | P-value |
| 33.7817 | 1.10482 | 1.61266 | 81 | 1.66388 | 0.0553538 |
Test is not significant at 5% level.
P-value Graph: t-Test
Null density (in units of data): Student t; mean = 32, scale = 1.1048, df = 81
Alternative Hypothesis Ha: Mean of 'Miles Per Gallon' is greater than 32
Test of Hypothesis: z-Test
Miles Per Gallon
Alternative Hypothesis Ha: Mean of 'Miles Per Gallon' is greater than 32
5% upper critical value in units of data = 33.81727
| Sample Mean | Std Error | Obs z Stat | 5% z-Upper Critical | P-Value |
| 33.7817 | 1.10482 | 1.61266 | 1.64485 | 0.053409 |
Test is not significant at 5% level.
P-value Graph: z-Test
Null density (in units of data): Normal; mean = 32 , sd = 1.1048
Alternative Hypothesis Ha: Mean of 'Miles Per Gallon' is greater than 32
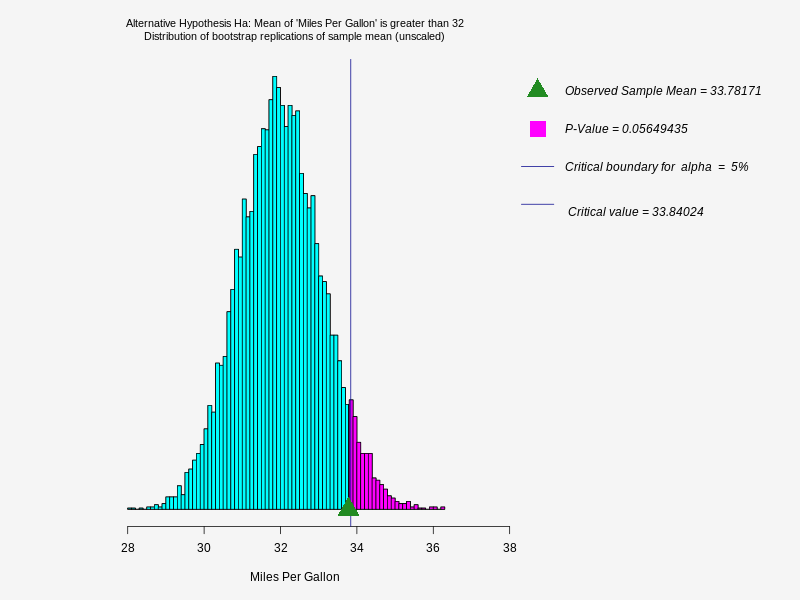
Test of Hypothesis: Bootstrap (Unscaled Sample Mean)
Miles Per Gallon
Alternative Hypothesis Ha: Mean of 'Miles Per Gallon' is greater than 32
Number of replications = 10000; Random generator seed = 100
| Observed Sample Mean | Bootstrap Mean | Bootstrap SD | 5% Upper Critical Value | P-Value |
| 33.7817 | 32.0074 | 1.09117 | 33.8402 | 0.0564944 |
Test is not significant at 5% level.
Distribution of Bootstrap Replicates: Sample Mean
Miles Per Gallon
Number of replications = 10000, Random generator seed = 100
