17 Analysis of Two-Way Contingency Tables
The Contingency table function includes the following:
- Mosaic plot
- Chi-Square test of independence
- Chi-Squared Test of Independence: Likelihood Ratio Method
- Chi-Squared Test of Independence by Simulation
- Fisher Exact Test: Simulated p-value
- Fisher Exact Test: Exact p-value
- McNemar Test - Normal Theory
- McNemar Test - Normal Theory with Continuity Correction
- McNemar Exact Binomial Test
- Stuart-Maxwell Test for Marginal Homogeneity (McNemar Test)
- Generalized McNemar Test - Normal Theory with Continuity Correction
- Linear Trend test
- Cochran-Armitage Test for Trend Association
17.1 Tests of independence and mosaic plot
Instructions for analysis of two-way contingency tables in Rguroo
- Use a dataset in your Rguroo account or recreate the example below by importing the HairEyeColor dataset from the Rguroo dataset repository called R Dataset into your account.
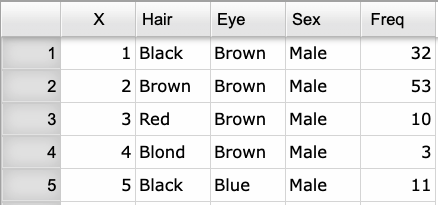
Click here to see a portion of the dataset.
Open the Analytics toolbox on the left-hand side of the Rguroo window. Use the
Analysisdropdown menu and choose Contingency Table (see Figure 17.1) .Select a Dataset.
From the Factor 1 and Factor 2 dropdowns, select the categorical variables. If your data is in tabular form where frequencies are given in a separate column, select your Frequency variable.
Under the Test of Independence section, select a method (with graph, if desired). Also, set the Significance Level.
(Optional) Select Mosaic Plot.
Click the Preview icon
 to view the result.
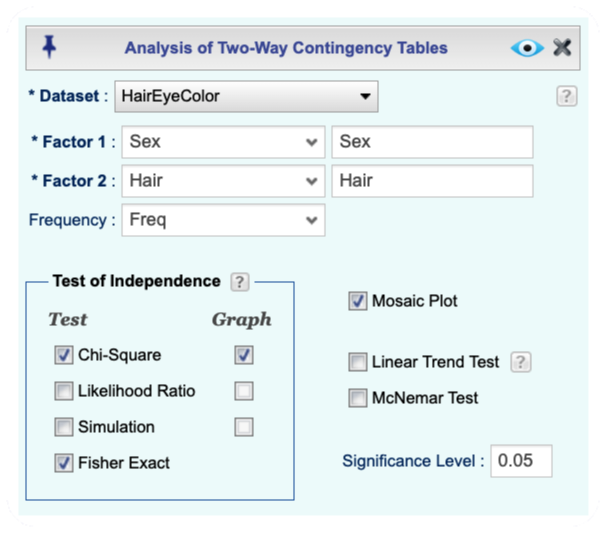
Figure 17.1: Analysis of two-way contingency table dialog
17.2 Linear trend test and McNemar test
Rguroo includes options for perfuming Linear trend test and McNemar tests in the Analysis of Two-Way Contingency Tables dialog, shown in Figure 17.1. These tests are used for the analysis of contingency tables that do not involve tests of independence.
17.2.1 Linear Trend Test
The Linear Trend Test evaluates the null hypothesis that the Spearman correlation coefficient (\(\rho\)) between two variables is zero. Both variables are assumed to be ordinal with equally spaced levels.
- This test can also be applied if one or both variables are nominal with only two levels.
- The test statistic is sometimes referred to as the Mantel-Haenszel statistic (\(M^2\)).
- When the response variable has only two levels, this test is known as the Cochran-Armitage test.
17.2.2 McNemar Test
The McNemar Test examines the null hypothesis that the marginal proportions of the row and column variables are equivalent.
- This test is used for \(2\times2\) contingency tables, where it is called McNemar’s test, and for larger square tables, where it is referred to as a test of marginal homogeneity.
- It is often considered the paired equivalent of the chi-square test of independence and is appropriate when the same categorical variable is measured in the same sample under two different conditions.
- Both factors must have the same number of levels for this test to be applicable.