Observed Counts
Row Variable is Sex
Column Variable is Hair
| | Black | Blond | Brown | Red | Total |
| Female | 52 | 81 | 143 | 37 | 313 |
| Male | 56 | 46 | 143 | 34 | 279 |
| Total | 108 | 127 | 286 | 71 | 592 |
Mosaic Plot of Hair vs Sex
Chi-Squared Test of Independence
Research Hypothesis Ha: Sex and Hair are associated
| Observed Test Statistic | Degrees of Freedom | P-Value |
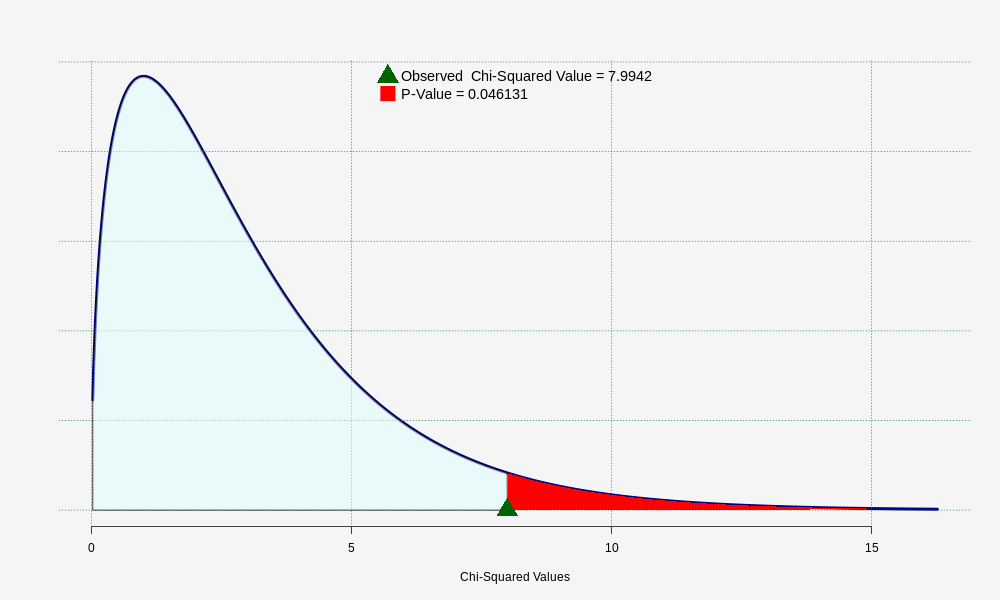
| 7.99424 | 3 | 0.04613 |
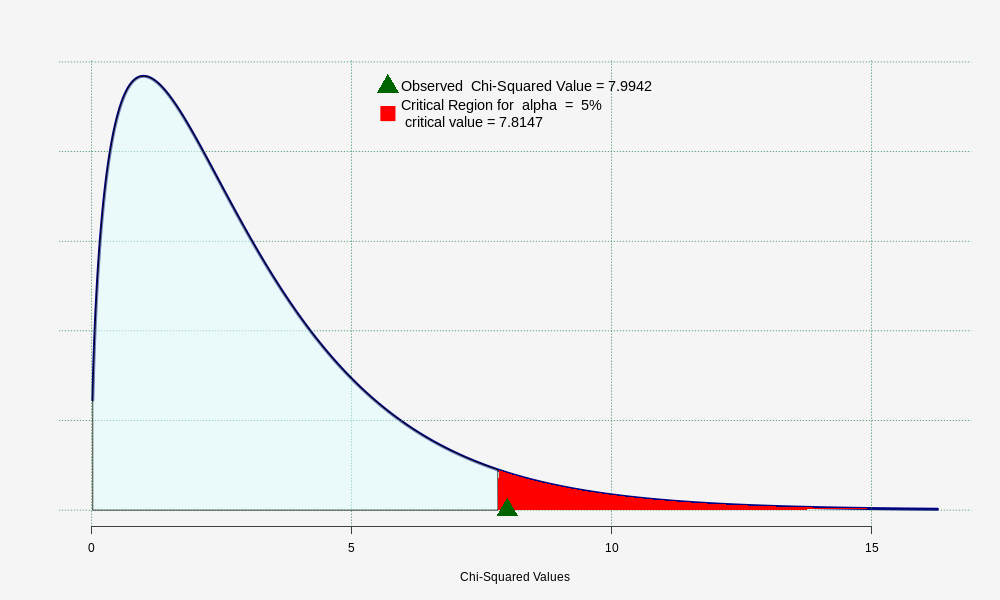
Test is significant at the 5% significance level
P-Value Graph:
Method: Chi-Squared Test of Independence
Null Density: Chi-Squared; df = 3
Null Hypothesis H0: Sex and Hair are independent
Critical Region Graph:
Method: Chi-Squared Test of Independence
Null Density: Chi-Squared; df = 3
Null Hypothesis H0: Sex and Hair are independent
Fisher Exact Test: Exact p-value
Research Hypothesis Ha: Sex and Hair are not independent.
Test is significant at the 5% significance level
Expected Counts
Row Variable is Sex
Column Variable is Hair
| | Black | Blond | Brown | Red | Total |
| Female | 57.1 | 67.15 | 151.21 | 37.54 | 313 |
| Male | 50.9 | 59.85 | 134.79 | 33.46 | 279 |
| Total | 108 | 127 | 286 | 71 | 592 |

