Data and Model Summary
| Number of cases used in the analysis | 82 |
| Number of incomplete (omitted) cases | 0 |
| Pearson Correlation Coefficient (r) | 0.96655 |
| Coefficient of Determination (R-Squared) | 0.93421 |
| Equation of Least Squares Line | SP = 84.454 + 0.2387 * HP |
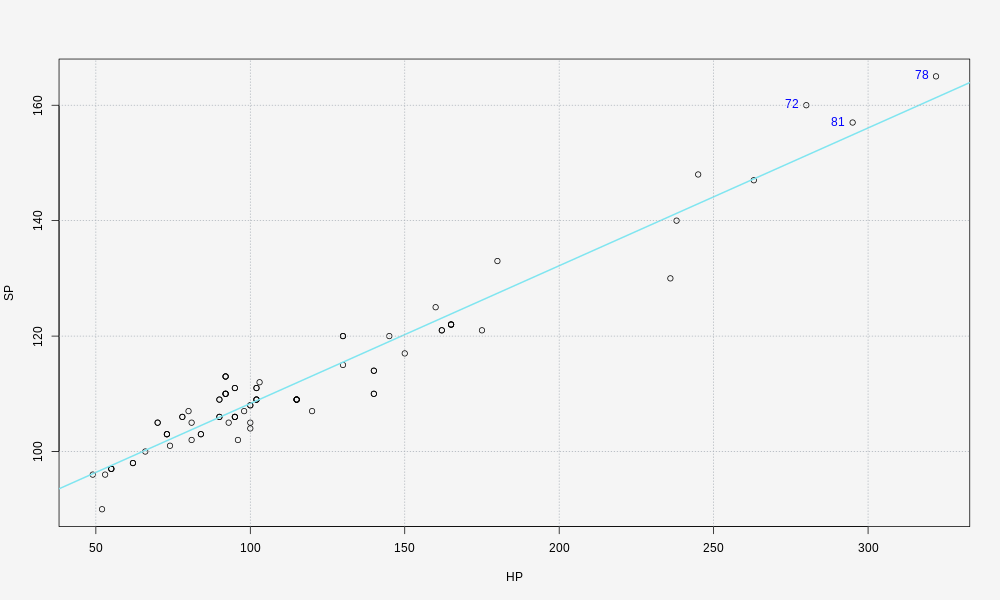
Response Versus Numerical Predictor
Least Squares Line: SP = 84.454 + 0.2387 * HP
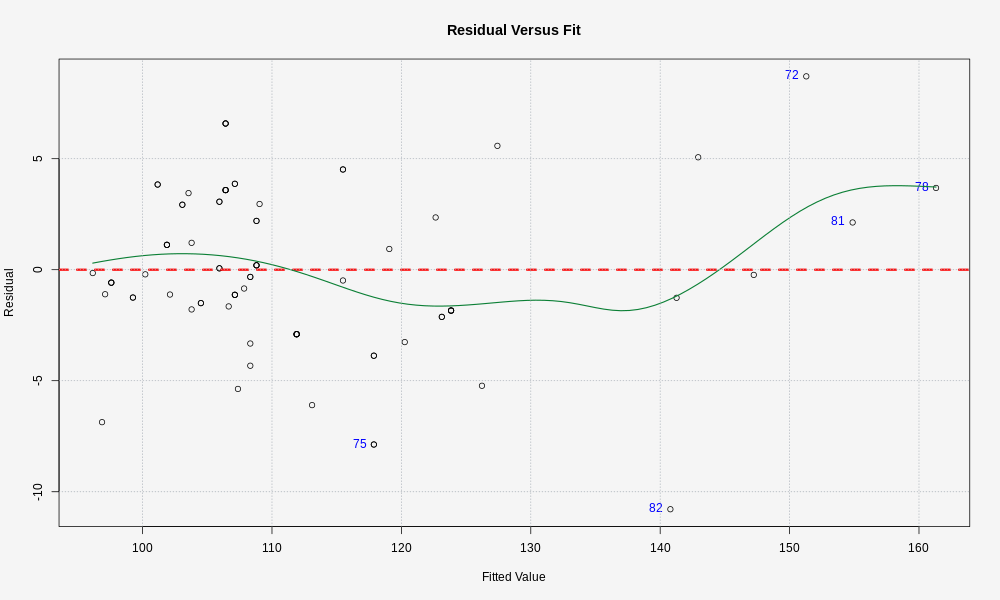
Residual Versus Fit
Least Squares Line: SP = 84.454 + 0.2387 * HP
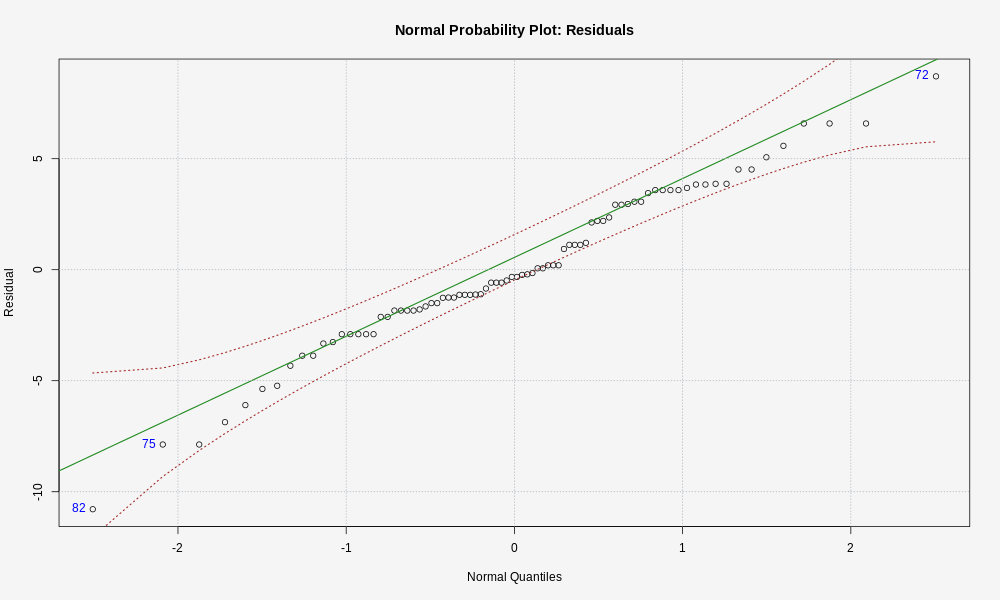
Normal Probability Plot: Residuals
Least Squares Line: SP = 84.454 + 0.2387 * HP