Data Summary
Model: weight ~ group + plot
Model: fixed effect
Data: Balanced
| Data.Used | No. |
|---|---|
| Number of cases read | 30 |
| Number of cases used in analysis | 30 |
| Number of incomplete cases (omitted) | 0 |
Count Summary
Model: weight ~ group + plotResponse Variable: weight
| Count | NAs (Missings) |
|---|---|
| 30 | 0 |
Effect: group
| group | Count | NAs (Missings) |
|---|---|---|
| ctrl | 10 | 0 |
| trt1 | 10 | 0 |
| trt2 | 10 | 0 |
Effect: plot
| plot | Count | NAs (Missings) |
|---|---|---|
| A | 15 | 0 |
| B | 15 | 0 |
ANOVA Table
Model: weight ~ group + plot
H0: The means for all levels are equal
| Source | DF | Sum of Squares | Mean Square | F Value | Pr>F | BFB |
|---|---|---|---|---|---|---|
| group | 2 | 3.76634 | 1.88317 | 9.40051 | 0.000847054 | 61.3967 |
| plot | 1 | 5.2836 | 5.2836 | 26.375 | 2.35008e-05 | 1468.68 |
| Residual | 26 | 5.20849 | 0.200326 |
group is significant at 5% significance level.
plot is significant at 5% significance level.
Boxplot:
Model: weight ~ group + plot

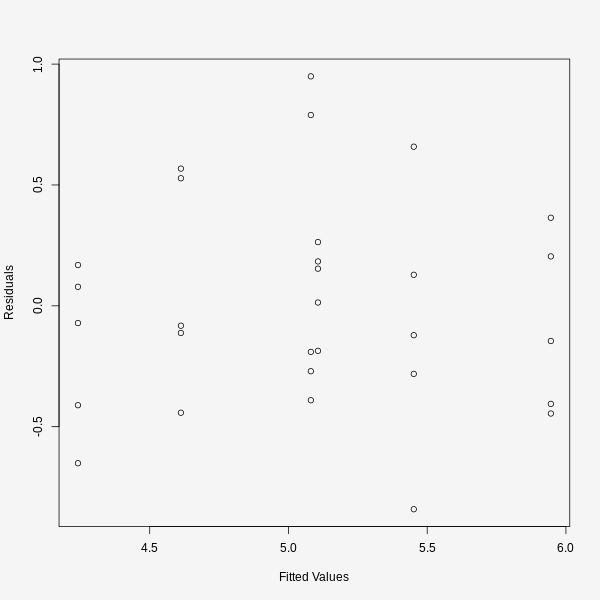
Residuals vs. Fitted
Model: weight ~ group + plot
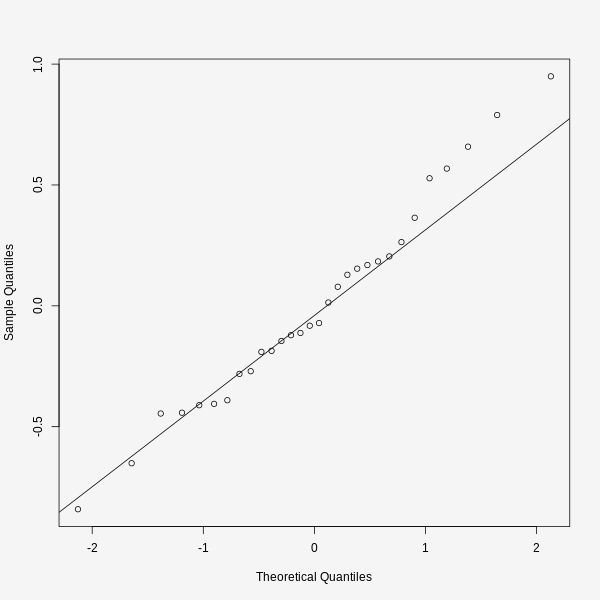
QQ-Plot for Residuals
Model: weight ~ group + plot
Levene's Test on Equality of Variances
(Median is used as center)
The null hypothesis: variances are equal.
| F Value | DF | P(>|F|) |
|---|---|---|
| 0.715407 | (5, 24) | 0.61802 |
Test is not significant at 5% significance level.
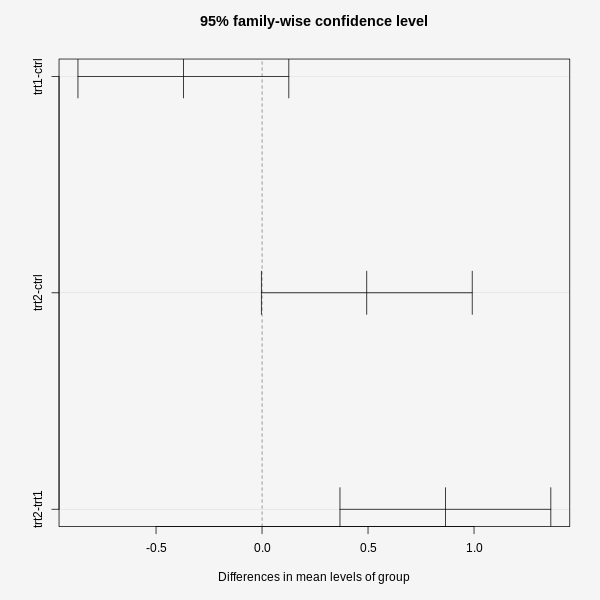
Tukey's HSD: Multiple Comparison of Means
Table of 95% family-wise confidence level
| Difference Levels | Mean | Lower Limit | Upper Limit | Adjusted p-value |
|---|---|---|---|---|
| trt1-ctrl | -0.371 | -0.868384 | 0.126384 | 0.172501 |
| trt2-ctrl | 0.494 | -0.00338414 | 0.991384 | 0.0518359 |
| trt2-trt1 | 0.865 | 0.367616 | 1.36238 | 0.000571992 |
Tukey's HSD: Multiple Comparison of Means
Graph of 95% family-wise confidence level
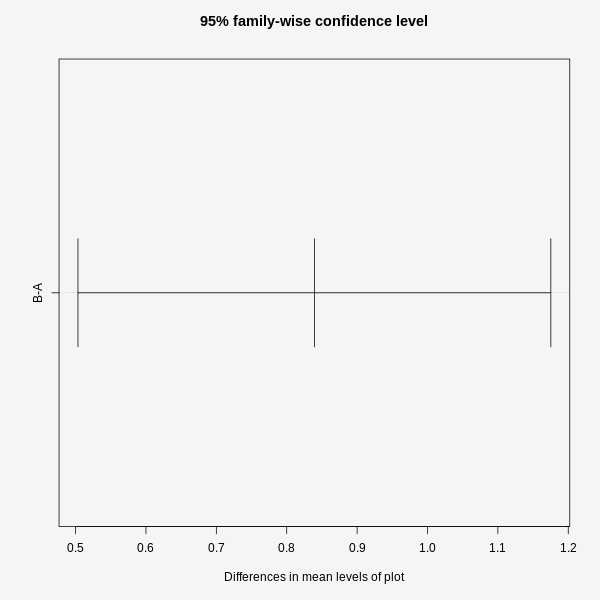
Tukey's HSD: Multiple Comparison of Means
Table of 95% family-wise confidence level
| Difference Levels | Mean | Lower Limit | Upper Limit | Adjusted p-value |
|---|---|---|---|---|
| B-A | 0.839333 | 0.503393 | 1.17527 | 2.35008e-05 |
Tukey's HSD: Multiple Comparison of Means
Graph of 95% family-wise confidence level