Data Summary
Model: weight ~ group
Model: fixed effect
Data: Balanced
| Data.Used | No. |
|---|---|
| Number of cases read | 30 |
| Number of cases used in analysis | 30 |
| Number of incomplete cases (omitted) | 0 |
Count Summary
Model: weight ~ groupResponse Variable: weight
| Count | NAs (Missings) |
|---|---|
| 30 | 0 |
Effect: group
| group | Count | NAs (Missings) |
|---|---|---|
| ctrl | 10 | 0 |
| trt1 | 10 | 0 |
| trt2 | 10 | 0 |
ANOVA Table
Model: weight ~ group
H0: The means for all levels are equal
| Source | DF | Sum of Squares | Mean Square | F Value | Pr>F | BFB |
|---|---|---|---|---|---|---|
| group | 2 | 3.76634 | 1.88317 | 4.84609 | 0.01591 | 5.58407 |
| Residual | 27 | 10.4921 | 0.388596 |
group is significant at 5% significance level.
Boxplot:
Model: weight ~ group

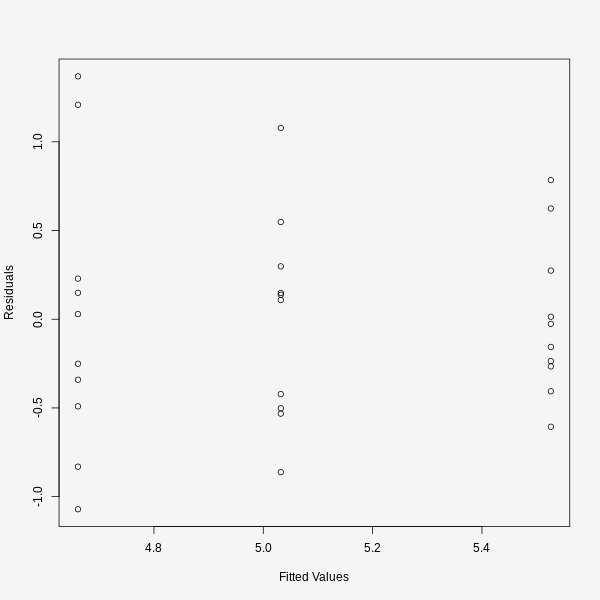
Residuals vs. Fitted
Model: weight ~ group
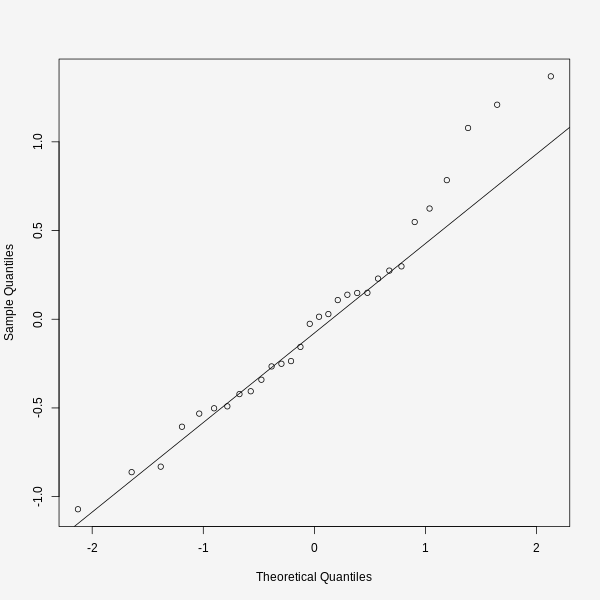
QQ-Plot for Residuals
Model: weight ~ group
Levene's Test on Equality of Variances
(Median is used as center)
The null hypothesis: variances are equal.
| F Value | DF | P(>|F|) |
|---|---|---|
| 1.11919 | (2, 27) | 0.341227 |
Test is not significant at 5% significance level.
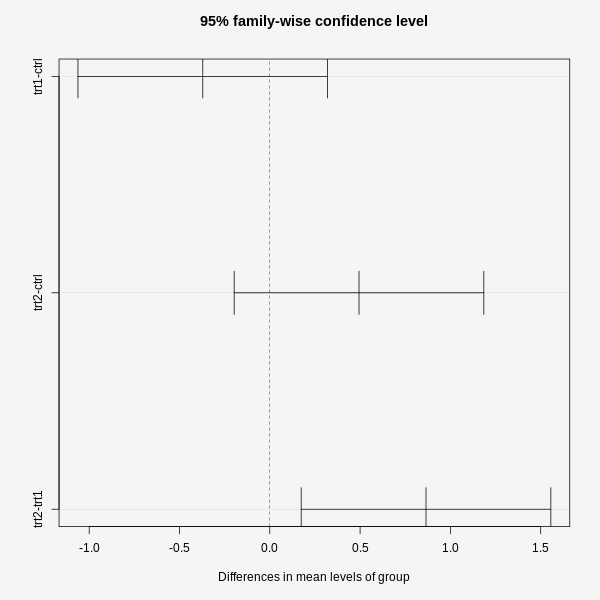
Tukey's HSD: Multiple Comparison of Means
Table of 95% family-wise confidence level
| Difference Levels | Mean | Lower Limit | Upper Limit | Adjusted p-value |
|---|---|---|---|---|
| trt1-ctrl | -0.371 | -1.06222 | 0.320216 | 0.390871 |
| trt2-ctrl | 0.494 | -0.197216 | 1.18522 | 0.197996 |
| trt2-trt1 | 0.865 | 0.173784 | 1.55622 | 0.0120064 |
Tukey's HSD: Multiple Comparison of Means
Graph of 95% family-wise confidence level